
Page 515 - Handbook of Properties of Textile and Technical Fibres
P. 515
488 Handbook of Properties of Textile and Technical Fibres
(a) (b)
Weibull-2 QQ plot Weibull - 3 QQ plot
2 4
3
1
2
0 1
log(-log(1-P )) –1 log(-log(1-P )) –1 0
–2
–3 –2
–3
–4 –4
–5 –5
0.5 1 1.5 2 2.5 3
3.55 3.6 3.65 3.7 3.75 3.8 3.85 3.9 3.95
Log (sigma order statistics) Log(sigma order statistics -B)
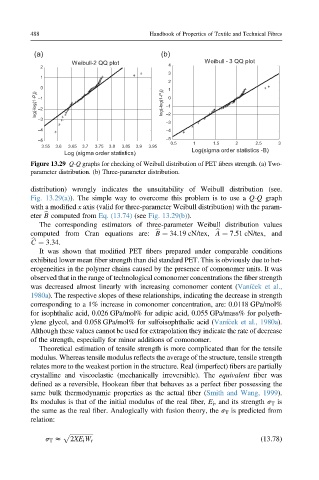
Figure 13.29 Q-Q graphs for checking of Weibull distribution of PET fibers strength. (a) Two-
parameter distribution. (b) Three-parameter distribution.
distribution) wrongly indicates the unsuitability of Weibull distribution (see.
Fig. 13.29(a)). The simple way to overcome this problem is to use a Q-Q graph
with a modified x axis (valid for three-parameter Weibull distribution) with the param-
eter B computed from Eq. (13.74) (see Fig. 13.29(b)).
b
The corresponding estimators of three-parameter Weibull distribution values
computed from Cran equations are: B ¼ 34.19 cN/tex, A ¼ 7.51 cN/tex, and
b
b
C ¼ 3.34.
b
It was shown that modified PET fibers prepared under comparable conditions
exhibited lower mean fiber strength than did standard PET. This is obviously due to het-
erogeneities in the polymer chains caused by the presence of comonomer units. It was
observed that in the range of technological comonomer concentrations the fiber strength
was decreased almost linearly with increasing comonomer content (Vaní cek et al.,
1980a). The respective slopes of these relationships, indicating the decrease in strength
corresponding to a 1% increase in comonomer concentration, are: 0.0118 GPa/mol%
for isophthalic acid, 0.026 GPa/mol% for adipic acid, 0.055 GPa/mass% for polyeth-
ylene glycol, and 0.058 GPa/mol% for sulfoisophthalic acid (Vaní cek et al., 1980a).
Although these values cannot be used for extrapolation they indicate the rate of decrease
of the strength, especially for minor additions of comonomer.
Theoretical estimation of tensile strength is more complicated than for the tensile
modulus. Whereas tensile modulus reflects the average of the structure, tensile strength
relates more to the weakest portion in the structure. Real (imperfect) fibers are partially
crystalline and viscoelastic (mechanically irreversible). The equivalent fiber was
defined as a reversible, Hookean fiber that behaves as a perfect fiber possessing the
same bulk thermodynamic properties as the actual fiber (Smith and Wang, 1999).
Its modulus is that of the initial modulus of the real fiber, E i , and its strength s T is
the same as the real fiber. Analogically with fusion theory, the s T is predicted from
relation:
s T z p ffiffiffiffiffiffiffiffiffiffiffiffiffiffiffi (13.78)
2XE i W r