Page 513 - Handbook of Properties of Textile and Technical Fibres
P. 513
486                             Handbook of Properties of Textile and Technical Fibres

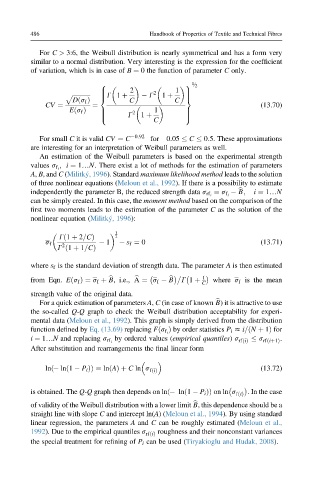
            For C > 3:6, the Weibull distribution is nearly symmetrical and has a form very
         similar to a normal distribution. Very interesting is the expression for the coefficient
         of variation, which is in case of B ¼ 0 the function of parameter C only.

                                                      2
                                                    9 1 =

                            8
                                    2

                            >             2     1 >
                            >
                   p ffiffiffiffiffiffiffiffiffiffiffiffi  >G 1 þ    G  1 þ  >
                                                   >
                            <                      =
                     Dðs f Þ        C           C
             CV ¼         ¼                                            (13.70)
                    Eðs f Þ  >       2     1       >
                                    G
                            >                      >
                            >          1 þ         >
                                           C
                            :                      ;
            For small C it is valid CV ¼ C  0:92  for  0:05   C   0:5. These approximations
         are interesting for an interpretation of Weibull parameters as well.
            An estimation of the Weibull parameters is based on the experimental strength
                 ; i ¼ 1.N. There exist a lot of methods for the estimation of parameters
         values s f i
         A, B, and C (Militký, 1996). Standard maximum likelihood method leads to the solution
         of three nonlinear equations (Meloun et al., 1992). If there is a possibility to estimate
                                                                 B;   i ¼ 1.N
         independently the parameter B, the reduced strength data s rf i  ¼ s f i  b
         can be simply created. In this case, the moment method based on the comparison of the
         first two moments leads to the estimation of the parameter C as the solution of the
         nonlinear equation (Militký, 1996):
                                1

                 Gð1 þ 2=CÞ     2
             s f  2           1    s f ¼ 0                             (13.71)
                 G ð1 þ 1=CÞ
         where s f is the standard deviation of strength data. The parameter A is then estimated
                                                        1
         from Eqn. Eðs f Þ¼ s f þ B, i.e., A ¼ s f   B  G 1 þ  where s f is the mean
                              b
                                                        C
                                               b
                                     b
         strength value of the original data.
            For a quick estimation of parameters A, C (in case of known B) it is attractive to use
                                                           b
         the so-called Q-Q graph to check the Weibull distribution acceptability for experi-
         mental data (Meloun et al., 1992). This graph is simply derived from the distribution
                                               Þ by order statistics P i z i=ðN þ 1Þ for
         function defined by Eq. (13.69) replacing Fðs f i
                                by ordered values (empirical quantiles) s    s  .
                                                                 rfðiÞ  rfðiþ1Þ
         i ¼ 1.N and replacing s rf i
         After substitution and rearrangements the final linear form

             lnð  lnð1   P i ÞÞ ¼ lnðAÞþ C ln s                        (13.72)
                                         fðiÞ

         is obtained. The Q-Q graph then depends on lnð  lnð1   P i ÞÞ on ln s  . In the case
                                                                 fðiÞ
         of validity of the Weibull distribution with a lower limit B, this dependence should be a
                                                     b
         straight line with slope C and intercept ln(A)(Meloun et al., 1994). By using standard
         linear regression, the parameters A and C can be roughly estimated (Meloun et al.,
         1992). Due to the empirical quantiles s  roughness and their nonconstant variances
                                        rfðiÞ
         the special treatment for refining of P i can be used (Tiryakioglu and Hudak, 2008).

