
Page 181 - Handbook of Surface Improvement and Modification
P. 181
176 The Coefficient of Friction
Figure 11.14. Skin-friction portable measuring probe:
(a) picture; and (b) outline. [Adapted, by permission,
from Ramalho, A; Szekeres, P; Fernandes, E, Tribol-
ogy Intl., 63, 29-33, 2013.]
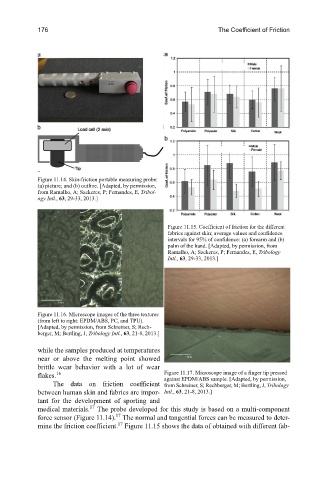
Figure 11.15. Coefficient of friction for the different
fabrics against skin; average values and confidence
intervals for 95% of confidence: (a) forearm and (b)
palm of the hand. [Adapted, by permission, from
Ramalho, A; Szekeres, P; Fernandes, E, Tribology
Intl., 63, 29-33, 2013.]
Figure 11.16. Microscope images of the three textures
(from left to right: EPDM/ABS, PC, and TPU).
[Adapted, by permission, from Schreiner, S; Rech-
berger, M; Bertling, J, Tribology Intl., 63, 21-8, 2013.]
while the samples produced at temperatures
near or above the melting point showed
brittle wear behavior with a lot of wear
16
flakes. Figure 11.17. Microscope image of a finger tip pressed
against EPDM/ABS sample. [Adapted, by permission,
The data on friction coefficient from Schreiner, S; Rechberger, M; Bertling, J, Tribology
between human skin and fabrics are impor- Intl., 63, 21-8, 2013.]
tant for the development of sporting and
17
medical materials. The probe developed for this study is based on a multi-component
17
force sensor (Figure 11.14). The normal and tangential forces can be measured to deter-
17
mine the friction coefficient. Figure 11.15 shows the data of obtained with different fab-