
Page 176 - Handbook of Surface Improvement and Modification
P. 176
11.1 Methods and mechanisms of improvement of the coefficient of friction 171
Polypropylene/viscose fiber with a
surface pattern consisting of periodic,
micro-scale cylindrical pillars was studied
regarding the effect of fiber loading and
micro-patterning on the friction and wear
6
properties of the composite. Testing was
done using pin-on-disc tribometer (Figure
6
11.7). In the case of a smooth counter sur-
face, both high fiber content and sparse
micro-bump coverage decreased the sliding
friction, but their synergetic effect pro-
Figure 11.7. Schematic representation of the modified duced a dramatic drop in friction coeffi-
pin-on-disc system where the pin has been replaced cient.
6
with a flat sample disc, the structured surface of the The influence of surface properties on
composite disc facing the directionally ground steel
counter surface. Black dots mark the measurement sliding contact temperature and friction was
areas, from which the friction and wear data was col- tested on the polyetheretherketone sam-
lected during the measurement. The arrow marks the ples. PEEK debris readily deposited on
7
trajectory of the sample disc during the measurement.
7
[Adapted, by permission, from Korpela, TE; Salstela, J; steel but not on sapphire. The adhesive
Suvanto, M; Pakkanen, TT, Wear, 310, 20-6, 2014.] friction of PEEK against steel was greater
7
than that for PEEK against sapphire. The
transfer of PEEK material to the steel surface may have elevated the temperature at the
7
sliding interface. Analysis of films transferred on steel suggests that PEEK was oriented
7
in the direction of sliding. The deposition of debris and formation of oriented films
resembled a high-temperature drawing process, which was likely to be due to localized
7
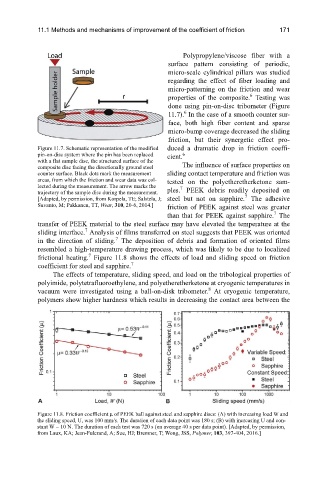
frictional heating. Figure 11.8 shows the effects of load and sliding speed on friction
7
coefficient for steel and sapphire.
The effects of temperature, sliding speed, and load on the tribological properties of
polyimide, polytetrafluoroethylene, and polyetheretherketone at cryogenic temperatures in
8
vacuum were investigated using a ball-on-disk tribometer. At cryogenic temperature,
polymers show higher hardness which results in decreasing the contact area between the
Figure 11.8. Friction coefficient μ of PEEK ball against steel and sapphire discs: (A) with increasing load W and
the sliding speed, U, was 100 mm/s. The duration of each data point was 180 s; (B) with increasing U and con-
stant W − 10 N. The duration of each test was 720 s (on average 40 s per data point). [Adapted, by permission,
from Laux, KA; Jean-Fulcrand, A; Sue, HJ; Bremner, T; Wong, JSS, Polymer, 103, 397-404, 2016.]