
Page 172 - Handbook of Surface Improvement and Modification
P. 172
11.1 Methods and mechanisms of improvement of the coefficient of friction 167
Table 11.1 gives examples of friction coefficients of some common materials for
comparison with discussed below information of materials which are subject of this chap-
ter.
Table 11.1. Friction coefficients of common materials
Static coefficient Dynamic coefficient
Material 1 Material 2
of friction of friction
Aluminum Aluminum 0.42 0.34
Aluminum Steel 0.35 0.25
Chromium Steel 0.25 0.21
Copper Steel 0.32 0.25
Copper Stainless steel 0.23 0.21
Cast iron Steel 0.40
Gold Gold 0.49
Graphite Graphite 0.18 0.14
Glass Steel 0.13 0.12
Silver Silver 0.50
Steel Steel 0.31 0.23
Steel ABS 0.30 0.35
Steel PVC 0.53 0.38
PTFE Chromium 0.09 0.08
PTFE Nickel 0.15 0.12
PTFE Aluminum 0.19 0.018
PTFE Steel 0.18 0.16
PTFE Glass 0.10 0.10
Ice Ice 0.01 0.01
Wood Concrete 0.61
Ice is the most slippery material. The
dynamic coefficient of friction is usually
lower than the static one.
Figure 11.1 shows tribometer which
was used for the measurement of polypro-
pylene, poly(ethylene terephthalate), and
2
high density polyethylene samples. Figure
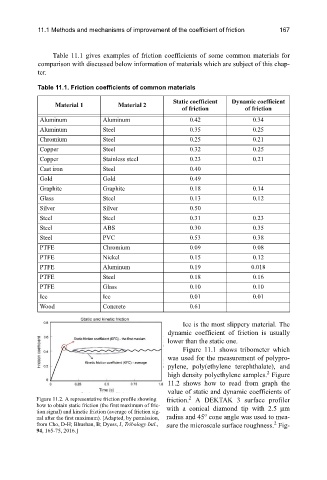
11.2 shows how to read from graph the
value of static and dynamic coefficients of
2
Figure 11.2. A representative friction profile showing friction. A DEKTAK 3 surface profiler
how to obtain static friction (the first maximum of fric- with a conical diamond tip with 2.5 μm
tion signal) and kinetic friction (average of friction sig- o
nal after the first maximum). [Adapted, by permission, radius and 45 cone angle was used to mea-
2
from Cho, D-H; Bhushan, B; Dyess, J, Tribology Intl., sure the microscale surface roughness. Fig-
94, 165-75, 2016.]