
Page 173 - Handbook of Surface Improvement and Modification
P. 173
168 The Coefficient of Friction
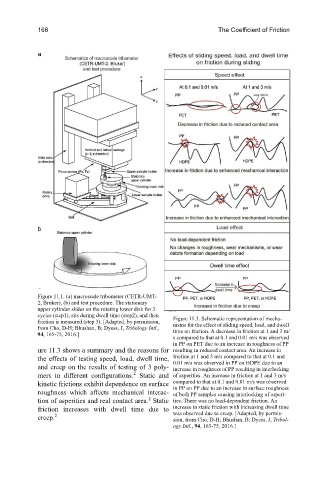
Figure 11.1. (a) macroscale tribometer (CETR-UMT-
2, Bruker), (b) and test procedure. The stationary
upper cylinder slides on the rotating lower disk for 3
cycles (step1), sits during dwell time (step2), and then Figure 11.3. Schematic representation of mecha-
friction is measured (step 3). [Adapted, by permission, nisms for the effect of sliding speed, load, and dwell
from Cho, D-H; Bhushan, B; Dyess, J, Tribology Intl., time on friction. A decrease in friction at 1 and 3 m/
94, 165-75, 2016.]
s compared to that at 0.1 and 0.01 m/s was observed
in PP on PET due to an increase in roughness of PP
ure 11.3 shows a summary and the reasons for resulting in reduced contact area. An increase in
the effects of testing speed, load, dwell time, friction at 1 and 3 m/s compared to that at 0.1 and
and creep on the results of testing of 3 poly- 0.01 m/s was observed in PP on HDPE due to an
increase in roughness of PP resulting in interlocking
2
mers in different configurations. Static and of asperities. An increase in friction at 1 and 3 m/s
kinetic frictions exhibit dependence on surface compared to that at 0.1 and 0.01 m/s was observed
roughness which affects mechanical interac- in PP on PP due to an increase in surface roughness
of both PP samples causing interlocking of asperi-
2
tion of asperities and real contact area. Static ties. There was no load-dependent friction. An
friction increases with dwell time due to increase in static friction with increasing dwell time
2
creep. was observed due to creep. [Adapted, by permis-
sion, from Cho, D-H; Bhushan, B; Dyess, J, Tribol-
ogy Intl., 94, 165-75, 2016.]