
Page 49 - Handbook of Surface Improvement and Modification
P. 49
44 Gloss Enhancement
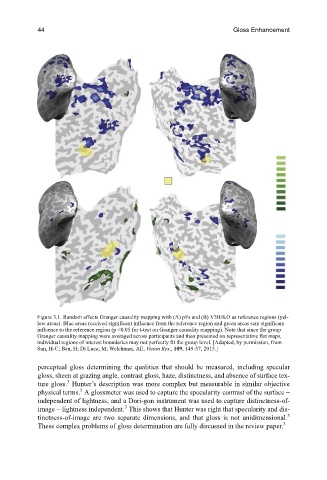
Figure 3.1. Random effects Granger causality mapping with (A) pFs and (B) V3B/KO as reference regions (yel-
low areas). Blue areas received significant influence from the reference region and green areas sent significant
influence to the reference region (p <0.05 for t-test on Granger causality mapping). Note that since the group
Granger causality mapping were averaged across participants and then presented on representative flat maps,
individual regions of interest boundaries may not perfectly fit the group level. [Adapted, by permission, from
Sun, H-C; Ban, H; Di Luca; M; Welchman, AE, Vision Res., 109, 149-57, 2015.]
perceptual gloss determining the qualities that should be measured, including specular
gloss, sheen at grazing angle, contrast gloss, haze, distinctness, and absence of surface tex-
3
ture gloss. Hunter’s description was more complex but measurable in similar objective
3
physical terms. A glossmeter was used to capture the specularity contrast of the surface −
independent of lightness, and a Dori-gon instrument was used to capture distinctness-of-
3
image − lightness independent. This shows that Hunter was right that specularity and dis-
tinctness-of-image are two separate dimensions, and that gloss is not unidimensional. 3
3
These complex problems of gloss determination are fully discussed in the review paper.