
Page 250 - High Power Laser Handbook
P. 250
218 So l i d - S t at e La s e r s Nd:YAG Ceramic ThinZag® High-Power Laser Development 219
The TZ-3 was designed to operate at 100 kW as six modules in a
series power oscillator. Each TZ-3 module was designed to be low
gain, so that ASE loss along the length of the slab would be minimal
when operated at full power. To increase the gain of the modules for
more efficient operation, an alternative mode of operation—namely,
low duty cycle (LDC)—was tested. In LDC mode, the current is
pulsed on for, say, 30 ms and off for 30 ms. The on times and off times
are somewhat arbitrary, though the pulse time should be long com-
pared with the kinetic lifetime of Nd:YAG (0.25 ms) and short com-
pared with the slab’s thermalization time (~1 s).
During the on time, the current is set much higher than the nomi-
nal 80-A full pump current used for CW operation; therefore, the
instantaneous gain is much higher. In this case, the laser operates at
the maximum allowed current of the Osram diodes. At the higher-
diode pump currents, the laser operates at higher gain, with more
efficient extraction and consequently lower thermal heating of the
slab. The LDC current is chosen such that the laser output essentially
doubles for the on time compared with the current for CW operation.
For LDC mode, the average laser output is the same as for CW cur-
rent; however, because of the more efficient extraction, the overall
heating of the slabs is reduced, as are thermal distortions. Figure 9.15
shows the calculated improved extraction for lower-output coupling
when operating in the LDC mode.
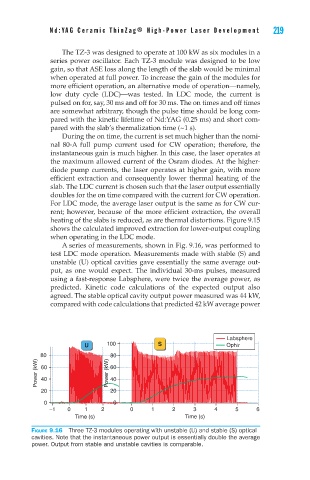
A series of measurements, shown in Fig. 9.16, was performed to
test LDC mode operation. Measurements made with stable (S) and
unstable (U) optical cavities gave essentially the same average out-
put, as one would expect. The individual 30-ms pulses, measured
using a fast-response Labsphere, were twice the average power, as
predicted. Kinetic code calculations of the expected output also
agreed. The stable optical cavity output power measured was 44 kW,
compared with code calculations that predicted 42 kW average power
Labsphere
U 100 S Ophir
80 80
Power (kW) 60 Power (kW) 60
40
40
20 20
0 0
−1 0 1 2 0 1 2 3 4 5 6
Time (s) Time (s)
Figure 9.16 Three TZ-3 modules operating with unstable (U) and stable (S) optical
cavities. Note that the instantaneous power output is essentially double the average
power. Output from stable and unstable cavities is comparable.