
Page 247 - High Power Laser Handbook
P. 247
216 So l i d - S t at e La s e r s Nd:YAG Ceramic ThinZag® High-Power Laser Development 217
Power (W) 3000
2000
1000
0
10 Power
Beam quality
Beam quality (xDL) 6 4
8
2
0 2 4 6 8 10
Time (s)
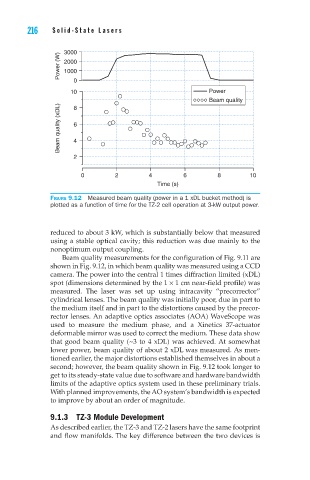
Figure 9.12 Measured beam quality (power in a 1 xDL bucket method) is
plotted as a function of time for the TZ-2 cell operation at 3-kW output power.
reduced to about 3 kW, which is substantially below that measured
using a stable optical cavity; this reduction was due mainly to the
nonoptimum output coupling.
Beam quality measurements for the configuration of Fig. 9.11 are
shown in Fig. 9.12, in which beam quality was measured using a CCD
camera. The power into the central 1 times diffraction limited (xDL)
spot (dimensions determined by the 1 × 1 cm near-field profile) was
measured. The laser was set up using intracavity “precorrector”
cylindrical lenses. The beam quality was initially poor, due in part to
the medium itself and in part to the distortions caused by the precor-
rector lenses. An adaptive optics associates (AOA) WaveScope was
used to measure the medium phase, and a Xinetics 37-actuator
deformable mirror was used to correct the medium. These data show
that good beam quality (~3 to 4 xDL) was achieved. At somewhat
lower power, beam quality of about 2 xDL was measured. As men-
tioned earlier, the major distortions established themselves in about a
second; however, the beam quality shown in Fig. 9.12 took longer to
get to its steady-state value due to software and hardware bandwidth
limits of the adaptive optics system used in these preliminary trials.
With planned improvements, the AO system’s bandwidth is expected
to improve by about an order of magnitude.
9.1.3 T Z-3 Module Development
As described earlier, the TZ-3 and TZ-2 lasers have the same footprint
and flow manifolds. The key difference between the two devices is