
Page 244 - High Power Laser Handbook
P. 244
212 So l i d - S t at e La s e r s Nd:YAG Ceramic ThinZag® High-Power Laser Development 213
6000
5000
4000
Power (W) 3000
2000
Ophir power meter
1000
Labsphere power meter
0
5 10 15 20 25 30
Time (s)
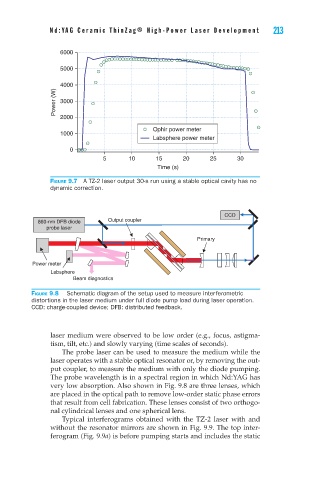
Figure 9.7 A TZ-2 laser output 30-s run using a stable optical cavity has no
dynamic correction.
CCD
860-nm DFB diode Output coupler
probe laser
Primary
Power meter
Labsphere
Beam diagnostics
Figure 9.8 Schematic diagram of the setup used to measure interferometric
distortions in the laser medium under full diode pump load during laser operation.
CCD: charge-coupled device; DFB: distributed feedback.
laser medium were observed to be low order (e.g., focus, astigma-
tism, tilt, etc.) and slowly varying (time scales of seconds).
The probe laser can be used to measure the medium while the
laser operates with a stable optical resonator or, by removing the out-
put coupler, to measure the medium with only the diode pumping.
The probe wavelength is in a spectral region in which Nd:YAG has
very low absorption. Also shown in Fig. 9.8 are three lenses, which
are placed in the optical path to remove low-order static phase errors
that result from cell fabrication. These lenses consist of two orthogo-
nal cylindrical lenses and one spherical lens.
Typical interferograms obtained with the TZ-2 laser with and
without the resonator mirrors are shown in Fig. 9.9. The top inter-
ferogram (Fig. 9.9a) is before pumping starts and includes the static