
Page 243 - High Power Laser Handbook
P. 243
212 So l i d - S t at e La s e r s Nd:YAG Ceramic ThinZag® High-Power Laser Development 213
6000
5000
4000
Power (W) 3000
2000
Labsphere power meter
1000 Ophir power meter
0
2 4 6 8 10 12
Time (s)
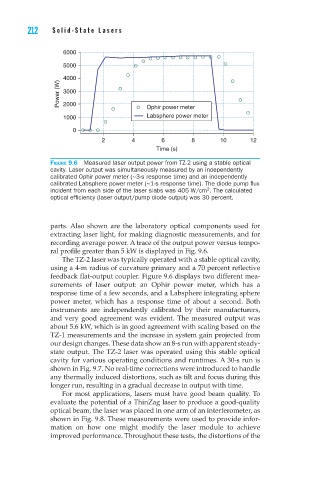
Figure 9.6 Measured laser output power from TZ-2 using a stable optical
cavity. Laser output was simultaneously measured by an independently
calibrated Ophir power meter (~3-s response time) and an independently
calibrated Labsphere power meter (~1-s response time). The diode pump flux
2
incident from each side of the laser slabs was 405 W/cm . The calculated
optical efficiency (laser output/pump diode output) was 30 percent.
parts. Also shown are the laboratory optical components used for
extracting laser light, for making diagnostic measurements, and for
recording average power. A trace of the output power versus tempo-
ral profile greater than 5 kW is displayed in Fig. 9.6.
The TZ-2 laser was typically operated with a stable optical cavity,
using a 4-m radius of curvature primary and a 70 percent reflective
feedback flat-output coupler. Figure 9.6 displays two different mea-
surements of laser output: an Ophir power meter, which has a
response time of a few seconds, and a Labsphere integrating sphere
power meter, which has a response time of about a second. Both
instruments are independently calibrated by their manufacturers,
and very good agreement was evident. The measured output was
about 5.6 kW, which is in good agreement with scaling based on the
TZ-1 measurements and the increase in system gain projected from
our design changes. These data show an 8-s run with apparent steady-
state output. The TZ-2 laser was operated using this stable optical
cavity for various operating conditions and runtimes. A 30-s run is
shown in Fig. 9.7. No real-time corrections were introduced to handle
any thermally induced distortions, such as tilt and focus during this
longer run, resulting in a gradual decrease in output with time.
For most applications, lasers must have good beam quality. To
evaluate the potential of a ThinZag laser to produce a good-quality
optical beam, the laser was placed in one arm of an interferometer, as
shown in Fig. 9.8. These measurements were used to provide infor-
mation on how one might modify the laser module to achieve
improved performance. Throughout these tests, the distortions of the