
Page 245 - High Power Laser Handbook
P. 245
214 So l i d - S t at e La s e r s Nd:YAG Ceramic ThinZag® High-Power Laser Development 215
−4
−2
(a) Before diode
0
pumping
2
4
−10 −5 0 5 10
−4
−2
(b) Diode pumping,
0
no lasing
2
4
−10 −5 0 5 10
−4
−2
(c) Diode pumping,
0
with lasing
2
4
−10 −5 0 5 10
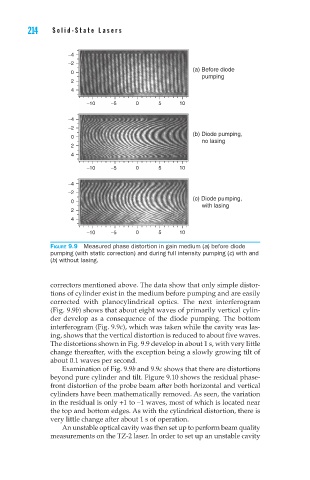
Figure 9.9 Measured phase distortion in gain medium (a) before diode
pumping (with static correction) and during full intensity pumping (c) with and
(b) without lasing.
correctors mentioned above. The data show that only simple distor-
tions of cylinder exist in the medium before pumping and are easily
corrected with planocylindrical optics. The next interferogram
(Fig. 9.9b) shows that about eight waves of primarily vertical cylin-
der develop as a consequence of the diode pumping. The bottom
interferogram (Fig. 9.9c), which was taken while the cavity was las-
ing, shows that the vertical distortion is reduced to about five waves.
The distortions shown in Fig. 9.9 develop in about 1 s, with very little
change thereafter, with the exception being a slowly growing tilt of
about 0.1 waves per second.
Examination of Fig. 9.9b and 9.9c shows that there are distortions
beyond pure cylinder and tilt. Figure 9.10 shows the residual phase-
front distortion of the probe beam after both horizontal and vertical
cylinders have been mathematically removed. As seen, the variation
in the residual is only +1 to –1 waves, most of which is located near
the top and bottom edges. As with the cylindrical distortion, there is
very little change after about 1 s of operation.
An unstable optical cavity was then set up to perform beam quality
measurements on the TZ-2 laser. In order to set up an unstable cavity