
Page 434 - High Power Laser Handbook
P. 434
402 So l i d - S t at e La s e r s The National Ignition Facility Laser 403
25 500
22% 220 22.5 450
20% 200 17.5 400
20
Power balance N081221-003-999 14% 140 Power (TW 96 beams) Power balance (%) 12.5 300 Power (TW 192 beams)
180
18%
350
16%
160
15
250
120
12%
100
10%
10
200
80
8%
7.5
150
60
6%
4%
50
2%
20
0
0
0% 40 2.5 5 0 100
(a) 0 2 4 6 8 10 12 14 (b) 0 2 4 6 8 10 12 14
Time (ns) Time (ns)
Power balance (48 Quads)
Rev 3.1... specs scaled to 1 MJ
Power balance (44 Quads)
Measured total power
Requested total power
Figure 14.40 Measured rms power balance on (a) 500-kJ, 96-beam and (b) 1-MJ,
192-beam shots fired in January and March of 2009, respectively, along with the
Rev. 3.1 power-balance specification scaled to the correct energy per beamline and
the requested 3ω pulse shapes (for reference). The 96-beam test was below the
specification throughout the pulse. On the 192-beam test, an error was made in
communicating the front-end request on four quads, causing the power balance to
be out of spec during the first 2 ns. Excluding those quads from the analysis, the
rms of the remaining 44 quads met the specification.
SXI upper SXI lower 64 µm RMS pointing error
150
100 µm circle
60 µm circle
100
Y distance (µm) −150 −100 −50 −50 0 50 100 150
50
−100
Upper beams
Lower beams
−150
X distance (µm)
(a) (b) (c)
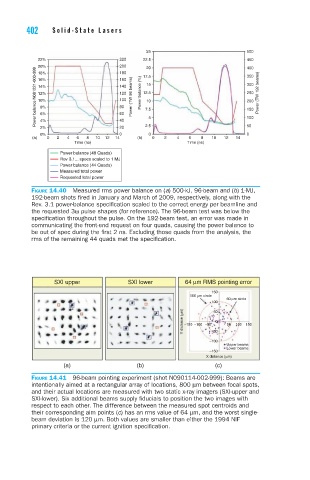
Figure 14.41 96-beam pointing experiment (shot N090114-002-999): Beams are
intentionally aimed at a rectangular array of locations, 800 μm between focal spots,
and their actual locations are measured with two static x-ray imagers (SXI-upper and
SXI-lower). Six additional beams supply fiducials to position the two images with
respect to each other. The difference between the measured spot centroids and
their corresponding aim points (c) has an rms value of 64 μm, and the worst single-
beam deviation is 120 μm. Both values are smaller than either the 1994 NIF
primary criteria or the current ignition specification.