
Page 299 - High Temperature Solid Oxide Fuel Cells Fundamentals, Design and Applications
P. 299
2 76 High Temperature Solid Oxide Fuel Cells: Fundamentals, Design and Applications
the outlet fuel and air may be obtained by gas analysis. The conversion
resistance, Rp,,,n,,er may be calculated using the concept of Emf,,,:
However, the anisotropic nature (temperature, gas composition, current flour)
of a real cell under current flom7 often invalidates this simple approach. Gas
conversion under electric load causes an uneven distribution of the current
density with decreasing current density in the downstream direction. Fuel
composition gradients over the cell originating from leaks cause different driving
potentials at different points. In extreme cases, this may result in high Emf areas
driving low Emf areas in electrolyser mode. Thus, internal currents may flow in
the cell even at open circuit voltage (OCV). Gas leaks in the cell also affect the
current density distribution under load and cause localised heating by
combustion. For tubular cell designs with high in-plane resistance, the current
density distribution may be affected: furthermore, the temperature may not be
constant over the whole cell length with flowing gases adding to the
inhomogeneity of the current density.
Modelling can simplify or reduce the extent of experimental task and predict
likely behaviour under a broad range of test conditions. However, subsequent
validation by comparison with relevant cell and stack data is always important.
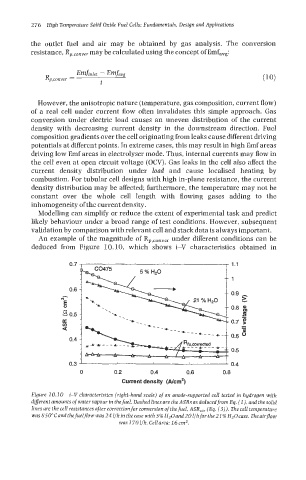
An example of the magnitude of Rp,conver under different conditions can be
deduced from Figure 10.10, which shows i-V characteristics obtained in
0.7 1.1
1
0.6
0.9
5
Y
N
Z 0.5
0.4
Ob
,
0.3 8 I 0.4
0 0.2 0.4 0.6 0.8
Current ctenslty (Alcrn'}
Figure 10.10 i-V characteristics (right-hand scale) of an anode-supported cell tested in hydrogen with
diflerent amounts of water vapour in the fuel. Dashed lines are the ASRs as deduced from Eq. (l), and the solid
lines are the cell resistances after correction for conversion of the fuel, ASR,,, (Eq. (3)). The cell temperature
was850cCandthefuelJ?ou~was241/hinthecase with 5% H20and201/hforthe21%H~Ocase. Theairjow
was 170 l/h. Cell area: 16 cm2.