
Page 303 - High Temperature Solid Oxide Fuel Cells Fundamentals, Design and Applications
P. 303
Testing ofEZectrodes, Cells and Short Stacks 279
values obtained in tests of Rim anode-supported thin-electrolyte cells [5 71 is
about 0.6-0.8 eV, often with a tendency towards lower values at increasing
temperatures as mentioned under Table 10.2. The same observation applies for
Risa thick electrolyte-supported cells with bi-layer cathodes [ 5 81. This is
comparable to the EA of the electrolyte and the anode, whereas the cathode has a
substantially higher EA.
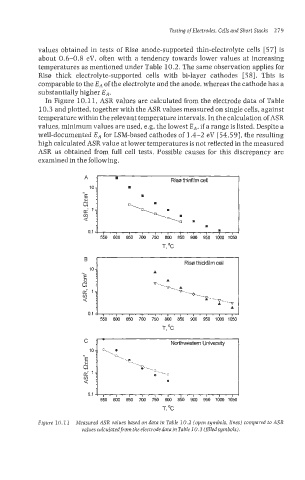
In Figure 10.11, ASR values are calculated from the electrode data of Table
10.3 and plotted, together with the ASR values measured on single cells, against
temperature within the relevant temperature intervals. In the calculation of ASR
values, minimum values are used, e.g. the lowest EA. if a range is listed. Despite a
well-documented EA for LSM-based cathodes of 1.4-2 eV [54,59], the resulting
high calculated ASR value at lower temperatures is not reflected in the measured
ASR as obtained from full cell tests. Possible causes for this discrepancy are
examined in the following.
A Rise thirrflm cell
10
4
o.q.,.,.,.,.,.,,l .,.,.:,,
550 600 650 700 750 800 850 900 950 1000 1050
T, 'C
5
Rispl thickfilm cell I
0.1! , . , . , . , . , . , . , . , . , . , . , I
550 600 650 700 750 800 850 900 950 1OM) 1050
T, OC
c 1- Northwestem University I
550 600 650 700 750 800 850 9M) 9-50 1000 1050
T, OC
Figure 7 0.1 1 Measured ASR values based on data in Table 10.2 (open symbols, lines) compared to ASR
values calculated from the electrodedata in Table 10.3 (jlledsymbok).