
Page 305 - High Temperature Solid Oxide Fuel Cells Fundamentals, Design and Applications
P. 305
Testing ofElectrodes, Cells and Short Stacks 28 1
10.5.3 Cathode Performance
Due to rather low EA of cell ASR compared to EA of cathodes, a tempting
explanation appears to be that cathodes just operate better on cells than in single
electrode tests. This might be due to water being present on the cathode side in
full cell tests, affecting the exchange properties of the electrolyte [60]; however,
any possible effect of water on the cathode performance was tested for Rim
cathodes and no effect was found. Also having hydrogen as the reference gas in
tests of cathodes on pellets showed no effect. Finally, an effect of small amounts of
Ni, which could diffuse to the cathode side during sintering was investigated but
only a very minor effect was observed [60]. However, differences in fabrication
methods of various types of full cells and cathodes on electrolytes may cause
unintended contaminations and segregations as well as differences in
microstructure, which might affect the cathode performance.
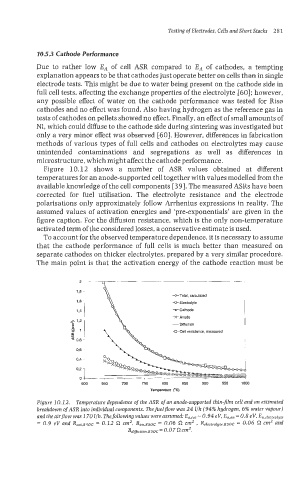
Figure 10.12 shows a number of ASR values obtained at different
temperatures for an anode-supported cell together with values modelled from the
available knowledge of the cell components [39]. The measured ASRs have been
corrected for fuel utilisation. The electrolyte resistance and the electrode
poIarisations only approximately follow Arrhenius expressions in reality. The
assumed values of activation energies and ‘pre-exponentials’ are given in the
figure caption. For the diffusion resistance, which is the only non-temperature
activated term of the considered losses, a conservative estimate is used.
To account for the observed temperature dependence, it is necessary to assume
that the cathode performance of full cells is much better than measured on
separate cathodes on thicker electrolytes, prepared by a very similar procedure.
The main point is that the activation energy of the cathode reaction must be
+Total. calculated
0 Eleclmlyte
+Cathode
‘B -X- Anode
- CUffusion
+Cell resistance, measured
600 650 700 750 800 850 900 950 1000
Temperature (%)
Figure 10.1 2. Temperature dependence of the ASR of an anode-supported thin-jlm cell and an estimated
breakdown of ASR into individual components. Thefuelflow was 24 l/h (94% hydrogen, 6% water vapour)
and the airflow was 170 llh. Thefollowing values were assumed: E,,,, = 0.94 eV, E,,,, = 0.8 eV, Ea,erectrolyte
= 0.9 eV and R~~t.850~ 0.12 a cm2, Ran.850C = 0.06 n em2 , Re1ectrogte.s50c = 0.06 cm2 and
=
Rdflurion.850C=0.07 aCm2.