
Page 306 - High Temperature Solid Oxide Fuel Cells Fundamentals, Design and Applications
P. 306
282 High Temperature Solid Oxide Fuel Cells: Fundamentals, Design and Applications
below 1 eV in order to obtain a reasonable good modelling of the cell
performance, whereas there seems to be a general agreement in the literature of
an activation energy in the vicinity of 1.4-2 eV [42].
The resistance measure used in Figure 10.12 is the minimum resistance
measure, that is the resistance at high polarisation. Better agreement between
cell performance and the performance expected from single electrode studies is
achieved if the comparison is based on impedance data, where the polarisation
is very small [45]. This is due to the non-linearity of the ceIl response at low
temperatures. As pointed out in Figures 10.8 and 10.10, the cell characteristic is
quite linear at least at a high temperature (SSOOC) and when measured in
high water vapour content. However, at lower temperatures the i-V curves are
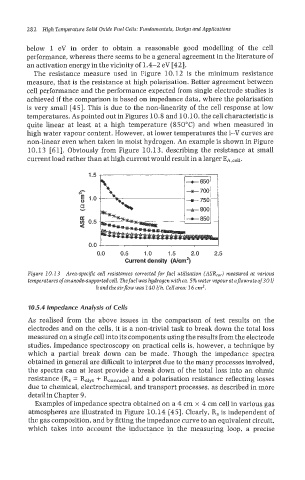
non-linear even when taken in moist hydrogen. An example is shown in Figure
10.13 [61]. Obviously from Figure 10.13, describing the resistance at small
current load rather than at high current would result in a larger EA,cell.
7
- 1.0 \-
N
E,
c:
Y
a
u) 0.5
b.
0.0
0.0 0.5 1.0 1.5 2.0 2.5
Current density (Nun2)
Figure 10.1 3 Area-spec@ cell resistances corrected for fuel utilisation (ASR,,,) measured at various
temperatures of an anode-supported cell. The fuel was hydrogen with ca. 5% water vapourat aflowrate of 30 ll
hand the airflow was 140 llh. Cell area: 16 cm2.
10.5.4 Impedance Analysis of Cells
As realised from the above issues in the comparison of test results on the
electrodes and on the cells, it is a non-trivial task to break down the total loss
measured on a single cell into its components using the results from the electrode
studies. Impedance spectroscopy on practical cells is, however, a technique by
which a partial break down can be made. Though the impedance spectra
obtained in general are difficult to interpret due to the many processes involved,
the spectra can at least provide a break down of the total loss into an ohmic
resistance (R, = + Rconnect) and a polarisation resistance reflecting losses
due to chemical, electrochemical, and transport processes, as described in more
detail in Chapter 9.
Examples of impedance spectra obtained on a 4 cm x 4 cm cell in various gas
atmospheres are illustrated in Figure 10.14 [45]. Clearly, R, is independent of
the gas composition, and by fitting the impedance curve to an equivalent circuit,
which takes into account the inductance in the measuring loop, a precise