
Page 300 - High Temperature Solid Oxide Fuel Cells Fundamentals, Design and Applications
P. 300
Testing ofEZectrodes, CeIZs and Short Stacks 277
hydrogen with either 5 or 20% water vapour for an anode-supported cell.
Also shown are the area specific resistance deduced directly from the curves
(OCV-U)/i curves and corrected for the fuel conversion (Eqs. (6) and (7)). The
correction is largest for the dry gas, where Rp,conBBr is ca. 0.12 S-2 cm2, reflecting
the gas composition dependence of the Nernst voltage.
After correcting €or the effect of non-negligible fuel utilisation, the cell
resistance is still significantly smaller when measured with 20% water in the feed
than with 5%. This reflects a gas composition dependence of some of the loss
terms in Eq. (2). In reference [45], it is argued that the observed composition
dependence is primarily due to the composition dependence of the diffusive losses
on the anode side (diffusion overvoItage), and it is shown how one may utilise
characteristics obtained with different water vapour/hydrogen ratios to assess
the magnitude of the diffusion loss [45].
10.5 Comparison of Test Results on Electrodes and on Cells
As mentioned earlier, cell performance within a certain operational envelope
can be fairly well described by just two parameters, namely a resistance (ASR)
and an overall activation energy (EA). Selected ASR values from tests on cells
and stacks from various sources, with apparent activation energies (EA) derived
by linear approximations of i-V curves for both low current density
( < 100 mA/cm2) and mid current density (100 < i < 1000 mA/cm2) over the
stated temperature intervals, are summarised in Table 10.2 [46]. The listed data
are not strictly comparable because gas composition, flow rate, fuel and air
utilisations, etc., are not known in all cases.
-
Values for RAnode, RCathode (Rp,elchern - RAnode -t RCathode) and RElyte derived from
tests of single electrodes and electrolytes are given in Table 10.3, selected on the
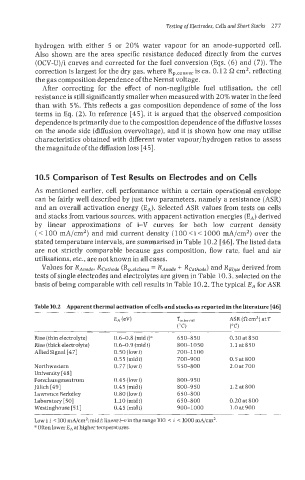
basis of being comparable with cell results in Table 10.2. The typical EA for ASR
Table 10.2 Apparent thermal activation of cells and stacks as reported in the literature I461
Risa (thin electrolyte) 0.6-0.8 (midi)" 650-8 50 0.30 at 850
Rise (thick electrolyte) 0.6-0.9 (midi) 800-1050 1.1 at 850
Allied Signal [47] 0.50 (lowi) 700-1 100
0.55 (midi) 700-900 0.5 at 800
Northwestern 0.77 (lowi) 550-800 2.0 at 700
University [48]
Forschungszentrum 0.45 (lowi) 800-950
Jiilich [49] 0.45 (midi) 800-950 1.2 at 800
Lawrence Berkeley 0.80 (10wi) 650-800
Laboratory [SO] 1.10 (midi) 650-800 0.20 at 800
Westinghouse [51] 0.45 (midi) 900-1000 1.0 at 900
Low i: i < 100 mA/cm2; midi: linear i-v in the range 100 < i < 1000 mA/cm2.
a Often lower EA at higher temperatures.