
Page 294 - High Temperature Solid Oxide Fuel Cells Fundamentals, Design and Applications
P. 294
Testing of Electrodes, Cells and Short Stacks 271
Such single-cell tests are useful to determine the performance of SOFCs under
ideal conditions where gold or platinum is used to make excellent current
contact with the electrodes. However, there can still be contact problems, as
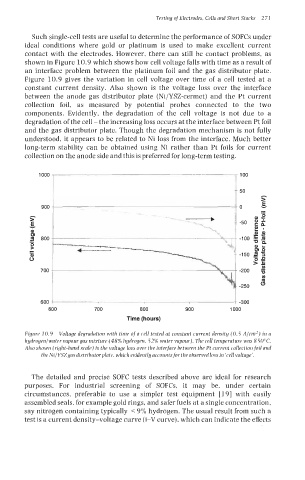
shown in Figure 10.9 which shows how cell voltage falls with time as a result of
an interface problem between the platinum foil and the gas distributor plate.
Figure 10.9 gives the variation in cell voltage over time of a cell tested at a
constant current density. Also shown is the voltage loss over the interface
between the anode gas distributor plate (Ni/YSZ-cermet) and the Pt current
collection foil, as measured by potential probes connected to the two
components. Evidently, the degradation of the cell voltage is not due to a
degradation of the cell - the increasing loss occurs at the interface between Pt foil
and the gas distributor plate. Though the degradation mechanism is not fully
understood, it appears to be related to Ni loss from the interface. Much better
long-term stability can be obtained using Ni rather than Pt foils for current
collection on the anode side and this is preferred for long-term testing.
l0O0 r-- I 100
>
h
E
900 0 Y
-50
-100
7-p-p i--- ’
700 -150
-200
u)
d
-250
600 -300
600 700 800 900 1000
lime (hours)
Figure 10.9 Voltage degradation with time ofa cell tested at constant current density (0.5 A/cm2) in a
hydrogenlwater vapour gas mixture (48% hydrogen, 52% water vapour). The cell temperature was 850°C.
Also shown (right-hand scale) is the voltage loss over the interface between the Pt current collectionfoil and
the Ni/YSZgasdistributorplate, which evidentlyaccountsfor the observedloss in ‘cell voltage’.
The detailed and precise SOFC tests described above are ideal for research
purposes. For industrial screening of SOFCs, it may be, under certain
circumstances, preferable to use a simpler test equipment [ 191 with easily
assembled seals, for example gold rings, and safer fuels at a single concentration,
say nitrogen containing typically < 9% hydrogen. The usual result from such a
test is a current density-voltage curve (i-V curve), which can indicate the effects