
Page 101 - Highway Engineering Handbook Building and Rehabilitating the Infrastructure
P. 101
84 CHAPTER TWO
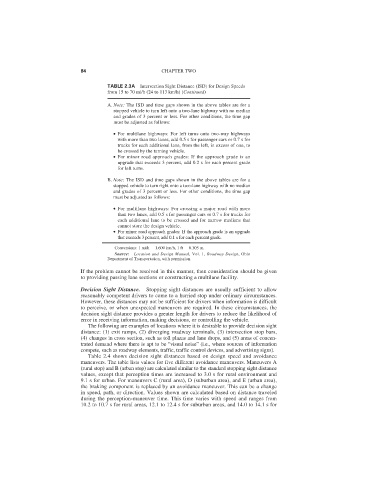
TABLE 2.3A Intersection Sight Distance (ISD) for Design Speeds
from 15 to 70 mi/h (24 to 113 km/h) (Continued)
A. Note: The ISD and time gaps shown in the above tables are for a
stopped vehicle to turn left onto a two-lane highway with no median
and grades of 3 percent or less. For other conditions, the time gap
must be adjusted as follows:
● For multilane highways: For left turns onto two-way highways
with more than two lanes, add 0.5 s for passenger cars or 0.7 s for
trucks for each additional lane, from the left, in excess of one, to
be crossed by the turning vehicle.
● For minor road approach grades: If the approach grade is an
upgrade that exceeds 3 percent, add 0.2 s for each percent grade
for left turns.
B. Note: The ISD and time gaps shown in the above tables are for a
stopped vehicle to turn right onto a two-lane highway with no median
and grades of 3 percent or less. For other conditions, the time gap
must be adjusted as follows:
● For multilane highways: For crossing a major road with more
than two lanes, add 0.5 s for passenger cars or 0.7 s for trucks for
each additional lane to be crossed and for narrow medians that
cannot store the design vehicle.
● For minor road approach grades: If the approach grade is an upgrade
that exceeds 3 percent, add 0.1 s for each percent grade.
Conversions: 1 mi/h 1.609 km/h, 1 ft 0.305 m.
Source: Location and Design Manual, Vol. 1, Roadway Design, Ohio
Department of Transportation, with permission.
If the problem cannot be resolved in this manner, then consideration should be given
to providing passing lane sections or constructing a multilane facility.
Decision Sight Distance. Stopping sight distances are usually sufficient to allow
reasonably competent drivers to come to a hurried stop under ordinary circumstances.
However, these distances may not be sufficient for drivers when information is difficult
to perceive, or when unexpected maneuvers are required. In these circumstances, the
decision sight distance provides a greater length for drivers to reduce the likelihood of
error in receiving information, making decisions, or controlling the vehicle.
The following are examples of locations where it is desirable to provide decision sight
distance: (1) exit ramps, (2) diverging roadway terminals, (3) intersection stop bars,
(4) changes in cross section, such as toll plazas and lane drops, and (5) areas of concen-
trated demand where there is apt to be “visual noise” (i.e., where sources of information
compete, such as roadway elements, traffic, traffic control devices, and advertising signs).
Table 2.4 shows decision sight distances based on design speed and avoidance
maneuvers. The table lists values for five different avoidance maneuvers. Maneuvers A
(rural stop) and B (urban stop) are calculated similar to the standard stopping sight distance
values, except that perception times are increased to 3.0 s for rural environment and
9.1 s for urban. For maneuvers C (rural area), D (suburban area), and E (urban area),
the braking component is replaced by an avoidance maneuver. This can be a change
in speed, path, or direction. Values shown are calculated based on distance traveled
during the perception-maneuver time. This time varies with speed and ranges from
10.2 to 10.7 s for rural areas, 12.1 to 12.4 s for suburban areas, and 14.0 to 14.1 s for