
Page 129 - How To Implement Lean Manufacturing
P. 129
108 Cha pte r S i x
Concerns?
• Threats
• Decisions
• Problems
Each requires its own methodology to resolve.
So that briefly describes one key part of problem solving, but what does this have
to do with standardization?
Standardization
Standardization is an attempt to get all the parties who perform some activity to per-
form it using the same skills and actions. It is an attempt to eliminate the variation that
exists in any activity.
Just how does this interact with problem solving? Maybe a real live example can
help clarify this question.
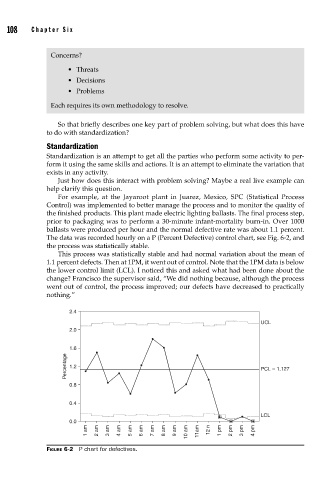
For example, at the Jayaroot plant in Juarez, Mexico, SPC (Statistical Process
Control) was implemented to better manage the process and to monitor the quality of
the finished products. This plant made electric lighting ballasts. The final process step,
prior to packaging was to perform a 30-minute infant-mortality burn-in. Over 1000
ballasts were produced per hour and the normal defective rate was about 1.1 percent.
The data was recorded hourly on a P (Percent Defective) control chart, see Fig. 6-2, and
the process was statistically stable.
This process was statistically stable and had normal variation about the mean of
1.1 percent defects. Then at 1PM, it went out of control. Note that the 1PM data is below
the lower control limit (LCL). I noticed this and asked what had been done about the
change? Francisco the supervisor said, “We did nothing because, although the process
went out of control, the process improved; our defects have decreased to practically
nothing.”
2.4
UCL
2.0
1.6
Percentage 1.2 PCL = 1.127
0.8
0.4
LCL
0.0
1 am 2 am 3 am 4 am 5 am 6 am 7 am 8 am 9 am 10 am 11am 12 n 1 pm 2 pm 3 pm 4 pm
FIGURE 6-2 P chart for defectives.