
Page 130 - How To Implement Lean Manufacturing
P. 130
How to Do Lean—Cultural Change Fundamentals 109
The science of SPC is designed so that when a process goes out of control (that is, a
plotted point on the control chart lies above the upper control limit or below the lower
control limit), we know with 99.73 percent certainty that the process has changed. It is
then a requirement that the cause of this change must be found and understood. These
causes have a unique name in the science of SPC. They are called special causes of varia-
tion. Then, if the special cause created an undesirable change (in this example, that would
be for the defects to increase and hence the plotted point would be above the upper con-
trol limit), you then have a problem to solve. However, if the special cause creates a desir-
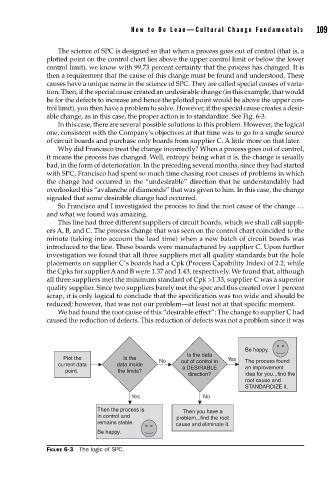
able change, as in this case, the proper action is to standardize. See Fig. 6-3.
In this case, there are several possible solutions to this problem. However, the logical
one, consistent with the Company’s objectives at that time was to go to a single source
of circuit boards and purchase only boards from supplier C. A little more on that later.
Why did Francisco treat the change incorrectly? When a process goes out of control,
it means the process has changed. Well, entropy being what it is, the change is usually
bad, in the form of deterioration. In the preceding several months, since they had started
with SPC, Francisco had spent so much time chasing root causes of problems in which
the change had occurred in the “undesirable” direction that he understandably had
overlooked this “avalanche of diamonds” that was given to him. In this case, the change
signaled that some desirable change had occurred.
So Francisco and I investigated the process to find the root cause of the change …
and what we found was amazing.
This line had three different suppliers of circuit boards, which we shall call suppli-
ers A, B, and C. The process change that was seen on the control chart coincided to the
minute (taking into account the lead time) when a new batch of circuit boards was
introduced to the line. These boards were manufactured by supplier C. Upon further
investigation we found that all three suppliers met all quality standards but the hole
placements on supplier C’s boards had a Cpk (Process Capability Index) of 2.2, while
the Cpks for supplier A and B were 1.37 and 1.43, respectively. We found that, although
all three suppliers met the minimum standard of Cpk >1.33, supplier C was a superior
quality supplier. Since two suppliers barely met the spec and this created over 1 percent
scrap, it is only logical to conclude that the specification was too wide and should be
reduced; however, that was not our problem—at least not at that specific moment.
We had found the root cause of this “desirable effect”: The change to supplier C had
caused the reduction of defects. This reduction of defects was not a problem since it was
Be happy.
Is the data
Plot the Is the No out of control in Yes The process found
current data data inside a DESIRABLE an improvement
point. the limits?
direction? idea for you...find the
root cause and
STANDARDIZE it.
Yes No
Then the process is Then you have a
in control and problem...find the root
remains stable. cause and eliminate it.
Be happy.
FIGURE 6-3 The logic of SPC.