
Page 73 - How To Implement Lean Manufacturing
P. 73
54 Cha pte r T h ree
Day Demand Day Demand
1 1400 17 1200
2 1400 18 1600
3 1800 19 1400
4 1400 20 1000
5 1500 21 1400
6 1000 22 1400
7 1800 23 1400
8 1500 24 1000
9 1200 25 1600
10 1400 26 1400
11 1600 27 1400
12 1400 28 1000
13 1600 29 1400
14 1400 30 1600
15 1400 Ave 1400
16 1400 Std Dev 208.0
TABLE 3-4 Demand Data
carry three boxes; two boxes of which would only be 100 units. In the final result, that
would mean we might short an order as much as 1 percent of the time. If we examine
these data, the variation for this 30-day period is a high of 1510 and a low of 1250. If the
pickup is 1400 units and that day we made only 1250, we would need an extra 150, to
complete the order, this is exactly what we have, so our system worked nicely to assure
on time delivery.
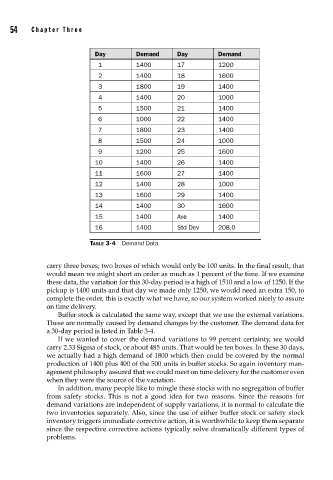
Buffer stock is calculated the same way, except that we use the external variations.
These are normally caused by demand changes by the customer. The demand data for
a 30-day period is listed in Table 3-4.
If we wanted to cover the demand variations to 99 percent certainty, we would
carry 2.33 Sigma of stock, or about 485 units. That would be ten boxes. In these 30 days,
we actually had a high demand of 1800 which then could be covered by the normal
production of 1400 plus 400 of the 500 units in buffer stocks. So again inventory man-
agement philosophy assured that we could meet on time delivery for the customer even
when they were the source of the variation.
In addition, many people like to mingle these stocks with no segregation of buffer
from safety stocks. This is not a good idea for two reasons. Since the reasons for
demand variations are independent of supply variations, it is normal to calculate the
two inventories separately. Also, since the use of either buffer stock or safety stock
inventory triggers immediate corrective action, it is worthwhile to keep them separate
since the respective corrective actions typically solve dramatically different types of
problems.