
Page 74 - How To Implement Lean Manufacturing
P. 74
Inventory and Variation 55
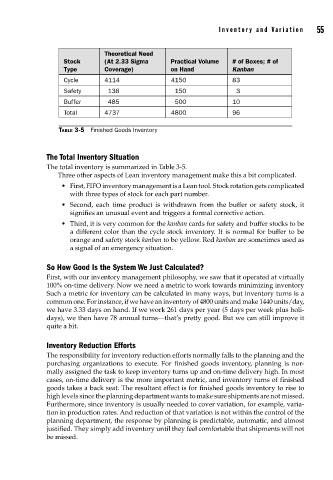
Theoretical Need
Stock (At 2.33 Sigma Practical Volume # of Boxes; # of
Type Coverage) on Hand Kanban
Cycle 4114 4150 83
Safety 138 150 3
Buffer 485 500 10
Total 4737 4800 96
TABLE 3-5 Finished Goods Inventory
The Total Inventory Situation
The total inventory is summarized in Table 3-5.
Three other aspects of Lean inventory management make this a bit complicated.
• First, FIFO inventory management is a Lean tool. Stock rotation gets complicated
with three types of stock for each part number.
• Second, each time product is withdrawn from the buffer or safety stock, it
signifies an unusual event and triggers a formal corrective action.
• Third, it is very common for the kanban cards for safety and buffer stocks to be
a different color than the cycle stock inventory. It is normal for buffer to be
orange and safety stock kanban to be yellow. Red kanban are sometimes used as
a signal of an emergency situation.
So How Good Is the System We Just Calculated?
First, with our inventory management philosophy, we saw that it operated at virtually
100% on-time delivery. Now we need a metric to work towards minimizing inventory
Such a metric for inventory can be calculated in many ways, but inventory turns is a
common one. For instance, if we have an inventory of 4800 units and make 1440 units/day,
we have 3.33 days on hand. If we work 261 days per year (5 days per week plus holi-
days), we then have 78 annual turns—that’s pretty good. But we can still improve it
quite a bit.
Inventory Reduction Efforts
The responsibility for inventory reduction efforts normally falls to the planning and the
purchasing organizations to execute. For finished goods inventory, planning is nor-
mally assigned the task to keep inventory turns up and on-time delivery high. In most
cases, on-time delivery is the more important metric, and inventory turns of finished
goods takes a back seat. The resultant effect is for finished goods inventory to rise to
high levels since the planning department wants to make sure shipments are not missed.
Furthermore, since inventory is usually needed to cover variation, for example, varia-
tion in production rates. And reduction of that variation is not within the control of the
planning department, the response by planning is predictable, automatic, and almost
justified. They simply add inventory until they feel comfortable that shipments will not
be missed.