
Page 72 - How To Implement Lean Manufacturing
P. 72
Inventory and Variation 53
customer failed to make a pickup for a few days, this would be the maximum volume
stored on-site. At that time, since there are only 83 kanban, each kanban would be attached
to a box that is held in cycle stock inventory. Since all 83 kanban are attached to boxes,
none work their way through the system to the heijunka board where they would trigger
production—hence, no more product would be made.
Buffer and Safety Stocks Calculations
For both buffer and safety stocks, the same logic and methodology is used. In both
cases, you use historical information to calculate the variation. We then determine an
acceptable level of on-time delivery, normally 99 percent, and to obtain this, we need a
z score of 2.33 sigma for a one-sided test. Therefore, we need 2.33 sigma volume of stock
to assure 99 percent on-time shipments in the case of buffer stocks. Now the required
volume to protect the supply can be determined. The difference between the calcula-
tions is that for safety stocks you use the data, which depicts the internal variation,
usually the production rate to the storehouse. On the other hand, for buffer stocks you
use the external variations that are typically the effects of demand fluctuations, plus
delivery variations.
Let’s calculate the safety stock for the preceding case:
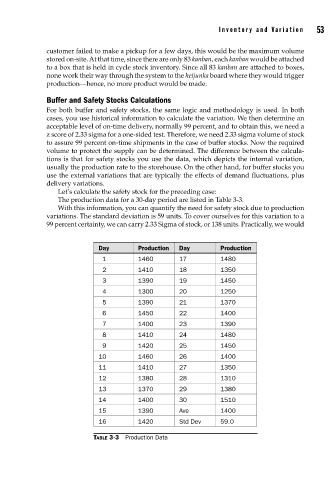
The production data for a 30-day period are listed in Table 3-3.
With this information, you can quantify the need for safety stock due to production
variations. The standard deviation is 59 units. To cover ourselves for this variation to a
99 percent certainty, we can carry 2.33 Sigma of stock, or 138 units. Practically, we would
Day Production Day Production
1 1460 17 1480
2 1410 18 1350
3 1390 19 1450
4 1300 20 1250
5 1390 21 1370
6 1450 22 1400
7 1400 23 1390
8 1410 24 1480
9 1420 25 1450
10 1460 26 1400
11 1410 27 1350
12 1380 28 1310
13 1370 29 1380
14 1400 30 1510
15 1390 Ave 1400
16 1420 Std Dev 59.0
TABLE 3-3 Production Data