
Page 179 - Hydrocarbon Exploration and Production Second Edition
P. 179
166 Data Interpretation
Figure 6.53 The formation resistivity log.
P 2 ΔP P 1
Q A
L
Q.µ.L
permeability K =
A. ΔP
core sample
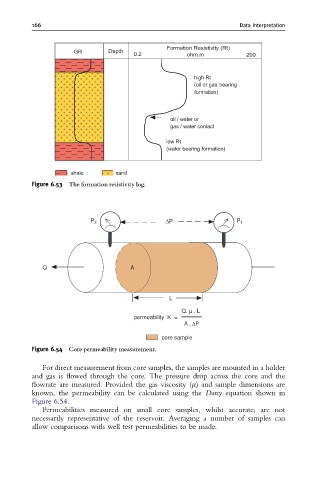
Figure 6.54 Core permeability measurement.
For direct measurement from core samples, the samples are mounted in a holder
and gas is flowed through the core. The pressure drop across the core and the
flowrate are measured. Provided the gas viscosity (m) and sample dimensions are
known, the permeability can be calculated using the Darcy equation shown in
Figure 6.54.
Permeabilities measured on small core samples, whilst accurate, are not
necessarily representative of the reservoir. Averaging a number of samples can
allow comparisons with well test permeabilities to be made.