
Page 183 - Hydrocarbon Exploration and Production Second Edition
P. 183
170 Data Interpretation
The routine core analysis data are plug porosity and permeability measurements
plus a GR log. The GR and plug porosities are compared to the log results to
improve the accuracy of the interpretation. A relationship between the logs and plug
permeabilities is established so that permeability can be inferred from the logs in
sections of reservoir that have not been cored.
The core itself is examined and logged by specialist sedimentologists and
structural geologists to identify key geological features. Many of these important
features can be observed from image logs which have been run through the whole
borehole and not just over the cored interval.
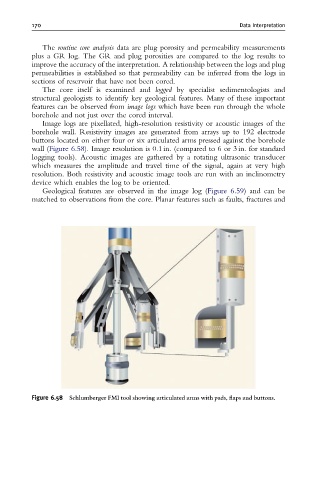
Image logs are pixellated, high-resolution resistivity or acoustic images of the
borehole wall. Resistivity images are generated from arrays up to 192 electrode
buttons located on either four or six articulated arms pressed against the borehole
wall (Figure 6.58). Image resolution is 0.1 in. (compared to 6 or 3 in. for standard
logging tools). Acoustic images are gathered by a rotating ultrasonic transducer
which measures the amplitude and travel time of the signal, again at very high
resolution. Both resistivity and acoustic image tools are run with an inclinometry
device which enables the log to be oriented.
Geological features are observed in the image log (Figure 6.59) and can be
matched to observations from the core. Planar features such as faults, fractures and
Figure 6.58 Schlumberger FMI tool showing articulated arms with pads, £aps and buttons.