
Page 191 - Hydrocarbon Exploration and Production Second Edition
P. 191
178 Expressing Uncertainty
for appraisal cannot be determined. Statistical methods are used to express ranges of
values of STOIIP, GIIP, UR and reserves.
7.2.1. The input to volumetric estimates
The input parameters to the calculation of volumetrics were introduced at the
beginning of Section 7.1. Let us take the STOIIP calculation as an example.
N 1
STOIIP ¼ GRV fS o ðstbÞ
G B o
Each of the input parameters has an uncertainty associated with it. This
uncertainty arises from the inaccuracy in the measured data, plus the uncertainty as
to what the values are for the parts of the field for which there are no measurements.
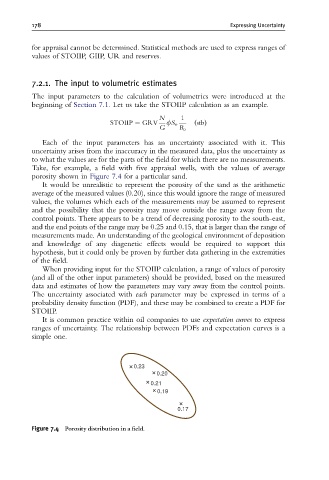
Take, for example, a field with five appraisal wells, with the values of average
porosity shown in Figure 7.4 for a particular sand.
It would be unrealistic to represent the porosity of the sand as the arithmetic
average of the measured values (0.20), since this would ignore the range of measured
values, the volumes which each of the measurements may be assumed to represent
and the possibility that the porosity may move outside the range away from the
control points. There appears to be a trend of decreasing porosity to the south-east,
and the end points of the range may be 0.25 and 0.15, that is larger than the range of
measurements made. An understanding of the geological environment of deposition
and knowledge of any diagenetic effects would be required to support this
hypothesis, but it could only be proven by further data gathering in the extremities
of the field.
When providing input for the STOIIP calculation, a range of values of porosity
(and all of the other input parameters) should be provided, based on the measured
data and estimates of how the parameters may vary away from the control points.
The uncertainty associated with each parameter may be expressed in terms of a
probability density function (PDF), and these may be combined to create a PDF for
STOIIP.
It is common practice within oil companies to use expectation curves to express
ranges of uncertainty. The relationship between PDFs and expectation curves is a
simple one.
0.23
0.20
0.21
0.19
0.17
Figure 7.4 Porosity distribution in a ¢eld.