
Page 192 - Hydrocarbon Exploration and Production Second Edition
P. 192
Volumetric Estimation 179
7.2.2. Probability density functions and expectation curves
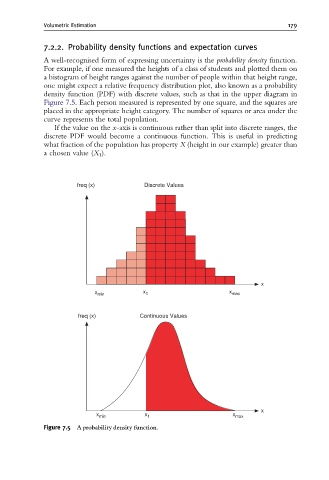
A well-recognised form of expressing uncertainty is the probability density function.
For example, if one measured the heights of a class of students and plotted them on
a histogram of height ranges against the number of people within that height range,
one might expect a relative frequency distribution plot, also known as a probability
density function (PDF) with discrete values, such as that in the upper diagram in
Figure 7.5. Each person measured is represented by one square, and the squares are
placed in the appropriate height category. The number of squares or area under the
curve represents the total population.
If the value on the x-axis is continuous rather than split into discrete ranges, the
discrete PDF would become a continuous function. This is useful in predicting
what fraction of the population has property X (height in our example) greater than
a chosen value (X 1 ).
freq (x) Discrete Values
x
x min x 1 x max
freq (x) Continuous Values
x
x min x 1 x max
Figure 7.5 A probability density function.