
Page 195 - Hydrocarbon Exploration and Production Second Edition
P. 195
182 Expressing Uncertainty
cum. p(x)
1
p(x) » 85%
PROVEN
2
3
PROVEN + p(x) » 50%
PROBABLE
1
3
PROVEN +
PROBABLE
p(x) » 15%
+ POSSIBLE
0
Low Medium High RESERVES
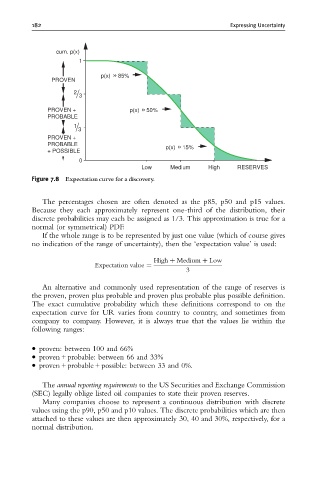
Figure 7.8 Expectation curve for a discovery.
The percentages chosen are often denoted as the p85, p50 and p15 values.
Because they each approximately represent one-third of the distribution, their
discrete probabilities may each be assigned as 1/3. This approximation is true for a
normal (or symmetrical) PDF.
If the whole range is to be represented by just one value (which of course gives
no indication of the range of uncertainty), then the ‘expectation value’ is used:
High þ Medium þ Low
Expectation value ¼
3
An alternative and commonly used representation of the range of reserves is
the proven, proven plus probable and proven plus probable plus possible definition.
The exact cumulative probability which these definitions correspond to on the
expectation curve for UR varies from country to country, and sometimes from
company to company. However, it is always true that the values lie within the
following ranges:
proven: between 100 and 66%
proven + probable: between 66 and 33%
proven + probable + possible: between 33 and 0%.
The annual reporting requirements to the US Securities and Exchange Commission
(SEC) legally oblige listed oil companies to state their proven reserves.
Many companies choose to represent a continuous distribution with discrete
values using the p90, p50 and p10 values. The discrete probabilities which are then
attached to these values are then approximately 30, 40 and 30%, respectively, for a
normal distribution.