
Page 198 - Hydrocarbon Exploration and Production Second Edition
P. 198
Volumetric Estimation 185
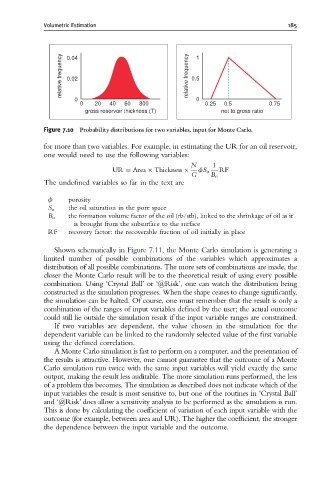
relative frequency 0.04 relative frequency 0.5 1
0.02
0 0
0 20 40 60 800 0.25 0.5 0.75
gross reservoir thickness (T) net to gross ratio
Figure 7.10 Probability distributions for two variables, input for Monte Carlo.
for more than two variables. For example, in estimating the UR for an oil reservoir,
one would need to use the following variables:
N 1
UR ¼ Area Thickness fS o RF
G B o
The undefined variables so far in the text are
f porosity
S o the oil saturation in the pore space
the formation volume factor of the oil (rb/stb), linked to the shrinkage of oil as it
B o
is brought from the subsurface to the surface
RF recovery factor: the recoverable fraction of oil initially in place
Shown schematically in Figure 7.11, the Monte Carlo simulation is generating a
limited number of possible combinations of the variables which approximates a
distribution of all possible combinations. The more sets of combinations are made, the
closer the Monte Carlo result will be to the theoretical result of using every possible
combination. Using ‘Crystal Ball’ or ‘@Risk’, one can watch the distribution being
constructed as the simulation progresses. When the shape ceases to change significantly,
the simulation can be halted. Of course, one must remember that the result is only a
combination of the ranges of input variables defined by the user; the actual outcome
could still lie outside the simulation result if the input variable ranges are constrained.
If two variables are dependent, the value chosen in the simulation for the
dependent variable can be linked to the randomly selected value of the first variable
using the defined correlation.
A Monte Carlo simulation is fast to perform on a computer, and the presentation of
the results is attractive. However, one cannot guarantee that the outcome of a Monte
Carlo simulation run twice with the same input variables will yield exactly the same
output, making the result less auditable. The more simulation runs performed, the less
of a problem this becomes. The simulation as described does not indicate which of the
input variables the result is most sensitive to, but one of the routines in ‘Crystal Ball’
and ‘@Risk’ does allow a sensitivity analysistobeperformed asthesimulationis run.
This is done by calculating the coefficient of variation of each input variable with the
outcome (for example, between area and UR). The higher the coefficient, the stronger
the dependence between the input variable and the outcome.