
Page 196 - Hydrocarbon Exploration and Production Second Edition
P. 196
Volumetric Estimation 183
7.2.2.2. Expectation curves for an exploration prospect
When an explorationist constructs an expectation curve, the above approach for the
volumetrics of an accumulation is taken, but one important additional parameter
must be taken into account: the probability of there being hydrocarbons present
at all. This probability is termed the probability of success (POS), and is estimated by
multiplying together the probability of there being
a source rock where hydrocarbons were generated
a reservoir in a structure which may trap hydrocarbons
a seal on top of the structure to stop the hydrocarbons migrating further
a migration path for the hydrocarbons from source rock to trap
the correct sequence of events in time (trap present as hydrocarbons migrated).
The estimated probabilities of each of these events occurring are multiplied
together to estimate the POS, since they must all occur simultaneously if a
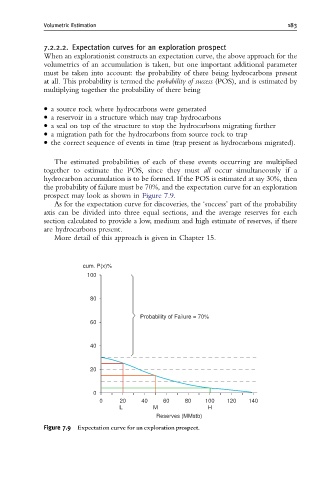
hydrocarbon accumulation is to be formed. If the POS is estimated at say 30%, then
the probability of failure must be 70%, and the expectation curve for an exploration
prospect may look as shown in Figure 7.9.
As for the expectation curve for discoveries, the ‘success’ part of the probability
axis can be divided into three equal sections, and the average reserves for each
section calculated to provide a low, medium and high estimate of reserves, if there
are hydrocarbons present.
More detail of this approach is given in Chapter 15.
cum. P(x)%
100
80
Probability of Failure = 70%
60
40
20
0
0 20 40 60 80 100 120 140
L M H
Reserves (MMstb)
Figure 7.9 Expectation curve for an exploration prospect.