
Page 210 - Hydrocarbon Exploration and Production Second Edition
P. 210
Field Appraisal 197
The decision tree can be considered as a road map which indicates the
chronological order in which a series of actions will be performed, and shows
several possible courses, only one of which will actually be followed.
The tree is drawn by starting with the first decision to be taken, asking
which actions are possible, and then considering all possible results from these
actions, followed by considering future actions to be taken when these results
are known, and so on. The tree is constructed in chronological order, from left
to right.
Then the values of the ‘leaves’ are placed on the diagram, starting in the far-most
future; the right hand side. The values on the leaves represent the NPVs of the
cashflows which correspond to the individual outcomes.
The probabilities of each branch from chance nodes are then estimated and noted
on the diagram.
Finally, the evaluation can be performed by ‘rolling back’ the tree, starting at the
leaves and working backwards towards the root of the tree.
For chance nodes it is not possible to foretell which will be the actual outcome,
so each result is considered with its corresponding probability. The value of a chance
node is the statistical (weighted) average of all its results.
For decision nodes, it is assumed that good management will lead us to decide
on the action which will result in the highest NPV. Hence the value of the decision
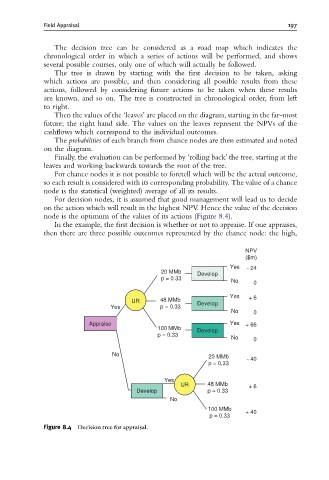
node is the optimum of the values of its actions (Figure 8.4).
In the example, the first decision is whether or not to appraise. If one appraises,
then there are three possible outcomes represented by the chance node: the high,
NPV
($m)
Yes - 24
20 MMb Develop
p = 0.33
No 0
Yes + 6
UR 48 MMb Develop
Yes p = 0.33
No 0
Appraise Yes + 66
100 MMb Develop
p = 0.33
No 0
No 20 MMb
- 40
p = 0.33
Yes
UR 48 MMb + 6
Develop p = 0.33
No
100 MMb + 40
p = 0.33
Figure 8.4 Decision tree for appraisal.