
Page 370 - Hydrocarbon Exploration and Production Second Edition
P. 370
Petroleum Economics 357
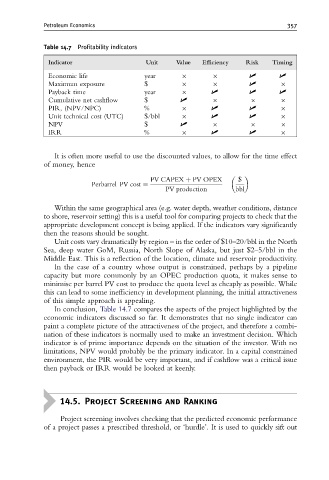
Table 14.7 Profitability indicators
Indicator Unit Value E⁄ciency Risk Timing
Economic life year | |
Maximum exposure $ |
Payback time year | | |
Cumulative net cashflow $ |
PIR, (NPV/NPC) % | |
Unit technical cost (UTC) $/bbl | |
NPV $ |
IRR % | |
It is often more useful to use the discounted values, to allow for the time effect
of money, hence
PV CAPEX þ PV OPEX $
Perbarrel PV cost ¼
PV production bbl
Within the same geographical area (e.g. water depth, weather conditions, distance
to shore, reservoir setting) this is a useful tool for comparing projects to check that the
appropriate development concept is being applied. If the indicators vary significantly
then the reasons should be sought.
Unit costs vary dramatically by region – in the order of $10–20/bbl in the North
Sea, deep water GoM, Russia, North Slope of Alaska, but just $2–5/bbl in the
Middle East. This is a reflection of the location, climate and reservoir productivity.
In the case of a country whose output is constrained, perhaps by a pipeline
capacity but more commonly by an OPEC production quota, it makes sense to
minimise per barrel PV cost to produce the quota level as cheaply as possible. While
this can lead to some inefficiency in development planning, the initial attractiveness
of this simple approach is appealing.
In conclusion, Table 14.7 compares the aspects of the project highlighted by the
economic indicators discussed so far. It demonstrates that no single indicator can
paint a complete picture of the attractiveness of the project, and therefore a combi-
nation of these indicators is normally used to make an investment decision. Which
indicator is of prime importance depends on the situation of the investor. With no
limitations, NPV would probably be the primary indicator. In a capital constrained
environment, the PIR would be very important, and if cashflow was a critical issue
then payback or IRR would be looked at keenly.
14.5. Project Screening and Ranking
Project screening involves checking that the predicted economic performance
of a project passes a prescribed threshold, or ‘hurdle’. It is used to quickly sift out