
Page 367 - Hydrocarbon Exploration and Production Second Edition
P. 367
354 Calculating a Discounted Cashflow
14.3.4. Discounting a net cashflow
The net cashflow discussed in Section 14.2 did not take account of the time value of
money, and was therefore an undiscounted net cashflow. The discounting technique
discussed can now be applied to this net cashflow to determine the PV of each
annual net cashflow at a specified reference date.
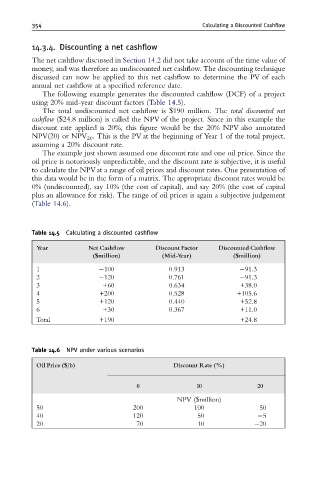
The following example generates the discounted cashflow (DCF) of a project
using 20% mid-year discount factors (Table 14.5).
The total undiscounted net cashflow is $190 million. The total discounted net
cashflow ($24.8 million) is called the NPV of the project. Since in this example the
discount rate applied is 20%, this figure would be the 20% NPV also annotated
NPV(20) or NPV 20 . This is the PV at the beginning of Year 1 of the total project,
assuming a 20% discount rate.
The example just shown assumed one discount rate and one oil price. Since the
oil price is notoriously unpredictable, and the discount rate is subjective, it is useful
to calculate the NPVat a range of oil prices and discount rates. One presentation of
this data would be in the form of a matrix. The appropriate discount rates would be
0% (undiscounted), say 10% (the cost of capital), and say 20% (the cost of capital
plus an allowance for risk). The range of oil prices is again a subjective judgement
(Table 14.6).
Table 14.5 Calculating a discounted cashflow
Year Net Cash£ow Discount Factor Discounted Cash£ow
($million) (Mid-Year) ($million)
1 100 0.913 91.3
2 120 0.761 91.3
3 +60 0.634 +38.0
4 +200 0.528 +105.6
5 +120 0.440 +52.8
6 +30 0.367 +11.0
Total +190 +24.8
Table 14.6 NPV under various scenarios
Oil Price ($/b) Discount Rate (%)
0 10 20
NPV ($million)
50 200 100 50
40 120 50 5
20 70 10 20