
Page 371 - Hydrocarbon Exploration and Production Second Edition
P. 371
358 Project Screening and Ranking
150
Proposal 1
100
NPV ($m)
50
Proposal 2
0
0 10 20 30 40
Discount Rate%
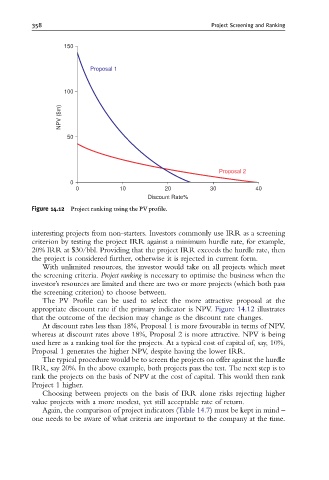
Figure 14.12 Project ranking using the PVpro¢le.
interesting projects from non-starters. Investors commonly use IRR as a screening
criterion by testing the project IRR against a minimum hurdle rate, for example,
20% IRR at $30/bbl. Providing that the project IRR exceeds the hurdle rate, then
the project is considered further, otherwise it is rejected in current form.
With unlimited resources, the investor would take on all projects which meet
the screening criteria. Project ranking is necessary to optimise the business when the
investor’s resources are limited and there are two or more projects (which both pass
the screening criterion) to choose between.
The PV Profile can be used to select the more attractive proposal at the
appropriate discount rate if the primary indicator is NPV. Figure 14.12 illustrates
that the outcome of the decision may change as the discount rate changes.
At discount rates less than 18%, Proposal 1 is more favourable in terms of NPV,
whereas at discount rates above 18%, Proposal 2 is more attractive. NPV is being
used here as a ranking tool for the projects. At a typical cost of capital of, say, 10%,
Proposal 1 generates the higher NPV, despite having the lower IRR.
The typical procedure would be to screen the projects on offer against the hurdle
IRR, say 20%. In the above example, both projects pass the test. The next step is to
rank the projects on the basis of NPV at the cost of capital. This would then rank
Project 1 higher.
Choosing between projects on the basis of IRR alone risks rejecting higher
value projects with a more modest, yet still acceptable rate of return.
Again, the comparison of project indicators (Table 14.7) must be kept in mind –
one needs to be aware of what criteria are important to the company at the time.