
Page 373 - Hydrocarbon Exploration and Production Second Edition
P. 373
360 Incorporating Inflation
100
Production
Oil
Price
50
Total
10% NPV $m Fixed
Opex
Opex
0
Capex
Production
-50
-60 -40 -20 0 +20 +40 +60
% Variation in input parameter
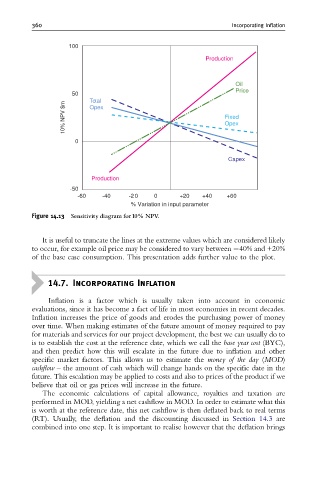
Figure 14.13 Sensitivity diagram for 10% NPV.
It is useful to truncate the lines at the extreme values which are considered likely
to occur, for example oil price may be considered to vary between 40% and +20%
of the base case consumption. This presentation adds further value to the plot.
14.7. Incorporating Inflation
Inflation is a factor which is usually taken into account in economic
evaluations, since it has become a fact of life in most economies in recent decades.
Inflation increases the price of goods and erodes the purchasing power of money
over time. When making estimates of the future amount of money required to pay
for materials and services for our project development, the best we can usually do to
is to establish the cost at the reference date, which we call the base year cost (BYC),
and then predict how this will escalate in the future due to inflation and other
specific market factors. This allows us to estimate the money of the day (MOD)
cashflow – the amount of cash which will change hands on the specific date in the
future. This escalation may be applied to costs and also to prices of the product if we
believe that oil or gas prices will increase in the future.
The economic calculations of capital allowance, royalties and taxation are
performed in MOD, yielding a net cashflow in MOD. In order to estimate what this
is worth at the reference date, this net cashflow is then deflated back to real terms
(RT). Usually, the deflation and the discounting discussed in Section 14.3 are
combined into one step. It is important to realise however that the deflation brings