
Page 142 - Hydrogeology Principles and Practice
P. 142
HYDC04 12/5/05 5:36 PM Page 125
Environmental isotope hydrogeology 125
18
2
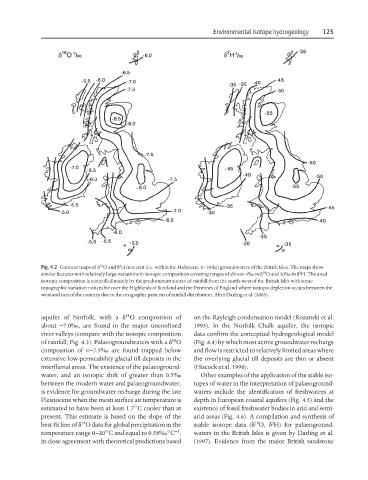
Fig. 4.2 Contour maps of δ O and δ H in recent (i.e. within the Holocene, 0–10 ka) groundwaters of the British Isles. The maps show
2
18
similar features with relatively large variations in isotopic composition covering ranges of almost 4‰ in δ O and 30‰ in δ H. The areal
isotopic composition is controlled mainly by the predominant source of rainfall from the south-west of the British Isles with some
topographic variation noticeable over the Highlands of Scotland and the Pennines of England where isotopic depletion occurs between the
west and east of the country due to the orographic patterns of rainfall distribution. After Darling et al. (2003).
18
aquifer of Norfolk, with a δ O composition of on the Rayleigh condensation model (Rozanski et al.
about −7.0‰, are found in the major unconfined 1993). In the Norfolk Chalk aquifer, the isotopic
river valleys (compare with the isotopic composition data confirm the conceptual hydrogeological model
18
of rainfall; Fig. 4.3). Palaeogroundwaters with a δ O (Fig. 4.4) by which most active groundwater recharge
composition of <−7.5‰ are found trapped below and flow is restricted to relatively limited areas where
extensive low-permeability glacial till deposits in the the overlying glacial till deposits are thin or absent
interfluvial areas. The existence of the palaeoground- (Hiscock et al. 1996).
water, and an isotopic shift of greater than 0.5‰ Other examples of the application of the stable iso-
between the modern water and palaeogroundwater, topes of water in the interpretation of palaeoground-
is evidence for groundwater recharge during the late waters include the identification of freshwaters at
Pleistocene when the mean surface air temperature is depth in European coastal aquifers (Fig. 4.5) and the
estimated to have been at least 1.7°C cooler than at existence of fossil freshwater bodies in arid and semi-
present. This estimate is based on the slope of the arid areas (Fig. 4.6). A compilation and synthesis of
18
18
2
best-fit line of δ O data for global precipitation in the stable isotope data (δ O, δ H) for palaeoground-
−1
temperature range 0–20°C and equal to 0.58‰°C , waters in the British Isles is given by Darling et al.
in close agreement with theoretical predictions based (1997). Evidence from the major British sandstone