
Page 205 - Hydrogeology Principles and Practice
P. 205
HYDC05 12/5/05 5:35 PM Page 188
188 Chapter Five
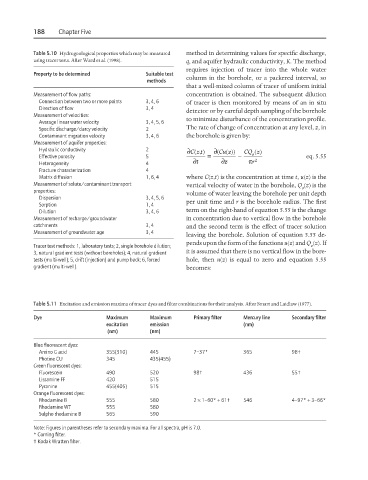
Table 5.10 Hydrogeological properties which may be measured method in determining values for specific discharge,
using tracer tests. After Ward et al. (1998). q, and aquifer hydraulic conductivity, K. The method
requires injection of tracer into the whole water
Property to be determined Suitable test
methods column in the borehole, or a packered interval, so
that a well-mixed column of tracer of uniform initial
Measurement of flow paths: concentration is obtained. The subsequent dilution
Connection between two or more points 3, 4, 6 of tracer is then monitored by means of an in situ
Direction of flow 3, 4 detector or by careful depth sampling of the borehole
Measurement of velocities:
Average linear water velocity 3, 4, 5, 6 to minimize disturbance of the concentration profile.
Specific discharge/darcy velocity 2 The rate of change of concentration at any level, z, in
Contaminant migration velocity 3, 4, 6 the borehole is given by:
Measurement of aquifer properties:
Hydraulic conductivity 2 ∂Cz t) ∂ Cu z)) CQ z()
(,
(
(
−
=
Effective porosity 5 o 2 eq. 5.55
Heterogeneity 4 ∂t ∂z πr
Fracture characterization 4
Matrix diffusion 1, 6, 4 where C(z,t) is the concentration at time t, u(z) is the
Measurement of solute/contaminant transport vertical velocity of water in the borehole, Q (z) is the
o
properties: volume of water leaving the borehole per unit depth
Dispersion 3, 4, 5, 6
Sorption 1, 4 per unit time and r is the borehole radius. The first
Dilution 3, 4, 6 term on the right-hand of equation 5.55 is the change
Measurement of recharge/groundwater in concentration due to vertical flow in the borehole
catchments 3, 4 and the second term is the effect of tracer solution
Measurement of groundwater age 3, 4
leaving the borehole. Solution of equation 5.55 de-
pends upon the form of the functions u(z) and Q (z). If
Tracer test methods: 1, laboratory tests; 2, single borehole dilution; o
3, natural gradient tests (without boreholes); 4, natural gradient it is assumed that there is no vertical flow in the bore-
tests (multi-well); 5, drift (injection) and pump back; 6, forced hole, then u(z) is equal to zero and equation 5.55
gradient (multi-well). becomes:
Table 5.11 Excitation and emission maxima of tracer dyes and filter combinations for their analysis. After Smart and Laidlaw (1977).
Dye Maximum Maximum Primary filter Mercury line Secondary filter
excitation emission (nm)
(nm) (nm)
Blue fluorescent dyes:
Amino G acid 355(310) 445 7–37* 365 98†
Photine CU 345 435(455)
Green fluorescent dyes:
Fluorescein 490 520 98† 436 55†
Lissamine FF 420 515
Pyranine 455(405) 515
Orange fluorescent dyes:
Rhodamine B 555 580 2 × 1–60* + 61† 546 4–97* + 3–66*
Rhodamine WT 555 580
Sulpho rhodamine B 565 590
Note: Figures in parentheses refer to secondary maxima. For all spectra, pH is 7.0.
* Corning filter.
† Kodak Wratten filter.