
Page 209 - Hydrogeology Principles and Practice
P. 209
HYDC05 12/5/05 5:35 PM Page 192
BO X
Convergent radial flow tracer test conducted at a sand and gravel aquifer site
5.5
In an investigation of the risk of road drainage entering a soakaway
and contaminating a well pumping from a sand and gravel aquifer,
Bateman et al. (2001) conducted a convergent radial flow test to
establish a connection between the soakaway and well and also to
determine a value for the aquifer longitudinal dispersivity (Section
6.3.1). The well has an open base with a single horizontal collecting
pipe extending 18.3 m to the north. To test a connection between
the road soakaway and the pumping well, a distance of 30 m,
60 g of fluorescein were injected into the soakaway and the recov-
ery monitored at the well. Prior to injection, 500 L of water were
trickled into the soakaway to wet the unsaturated zone above
the shallow water table. The tracer was flushed into the aquifer
following injection by trickling a further 2000 L of water into the
soakaway.
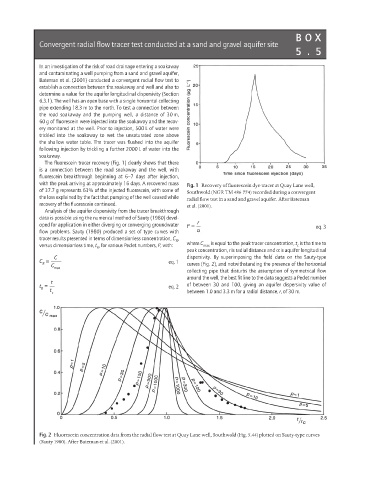
The fluorescein tracer recovery (Fig. 1) clearly shows that there
is a connection between the road soakaway and the well, with
fluorescein breakthrough beginning at 6–7 days after injection,
with the peak arriving at approximately 16 days. A recovered mass Fig. 1 Recovery of fluorescein dye-tracer at Quay Lane well,
of 37.7 g represents 63% of the injected fluorescein, with some of Southwold (NGR TM 486 774) recorded during a convergent
the loss explained by the fact that pumping of the well ceased while radial flow test in a sand and gravel aquifer. After Bateman
recovery of the fluorescein continued. et al. (2001).
Analysis of the aquifer dispersivity from the tracer breakthrough
data is possible using the numerical method of Sauty (1980) devel-
=
oped for application in either diverging or converging groundwater P r eq. 3
flow problems. Sauty (1980) produced a set of type curves with a
tracer results presented in terms of dimensionless concentration, C ,
R
versus dimensionless time, t , for various Peclet numbers, P, with: where C max is equal to the peak tracer concentration, t is the time to
c
R
peak concentration, r is radial distance and a is aquifer longitudinal
C dispersivity. By superimposing the field data on the Sauty-type
C = eq. 1
R C curves (Fig. 2), and notwithstanding the presence of the horizontal
max
collecting pipe that disturbs the assumption of symmetrical flow
around the well, the best fit line to the data suggests a Peclet number
t
t = eq. 2 of between 30 and 100, giving an aquifer dispersivity value of
R t
c between 1.0 and 3.3 m for a radial distance, r, of 30 m.
Fig. 2 Fluorescein concentration data from the radial flow test at Quay Lane well, Southwold (Fig. 5.44) plotted on Sauty-type curves
(Sauty 1980). After Bateman et al. (2001).