
Page 208 - Hydrogeology Principles and Practice
P. 208
HYDC05 12/5/05 5:35 PM Page 191
Groundwater investigation techniques 191
BO X
Single borehole dilution tracer test conducted at a Chalk aquifer site
5.4
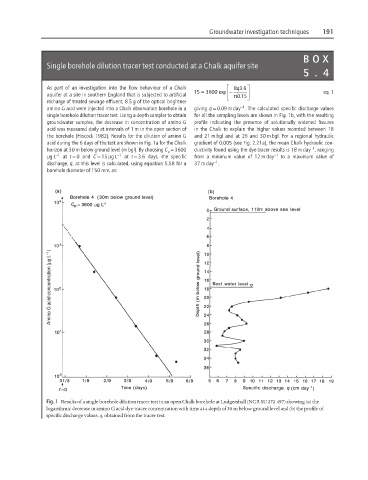
As part of an investigation into the flow behaviour of a Chalk = ⎡ 83 6 ⎤
q
.
aquifer at a site in southern England that is subjected to artificial 15 3600 exp − ⎢ ⎣ ⎢ p 015 ⎥ ⎥ ⎦ eq. 1
.
recharge of treated sewage effluent, 8.5 g of the optical brightner
−1
amino G acid were injected into a Chalk observation borehole in a giving q = 0.09 m day . The calculated specific discharge values
single borehole dilution tracer test. Using a depth sampler to obtain for all the sampling levels are shown in Fig. 1b, with the resulting
groundwater samples, the decrease in concentration of amino G profile indicating the presence of solutionally widened fissures
acid was measured daily at intervals of 1 m in the open section of in the Chalk to explain the higher values recorded between 18
the borehole (Hiscock 1982). Results for the dilution of amino G and 21 m bgl and at 26 and 30 m bgl. For a regional hydraulic
acid during the 6 days of the test are shown in Fig. 1a for the Chalk gradient of 0.005 (see Fig. 2.21a), the mean Chalk hydraulic con-
−1
horizon at 30 m below ground level (m bgl). By choosing C = 3600 ductivity found using the dye-tracer results is 18 m day , ranging
o
mgL −1 at t = 0 and C = 15 mgL −1 at t = 3.6 days, the specific from a minimum value of 12 m day −1 to a maximum value of
−1
discharge, q, at this level is calculated, using equation 5.58 for a 37 m day .
borehole diameter of 150 mm, as:
Amino G acid concentration (mg L −1 )
Fig. 1 Results of a single borehole dilution tracer test in an open Chalk borehole at Ludgershall (NGR SU 272 497) showing (a) the
logarithmic decrease in amino G acid dye-tracer concentration with time at a depth of 30 m below ground level and (b) the profile of
specific discharge values, q, obtained from the tracer test.