
Page 296 - Hydrogeology Principles and Practice
P. 296
HYDC08 12/5/05 5:31 PM Page 279
Groundwater resources and environmental management 279
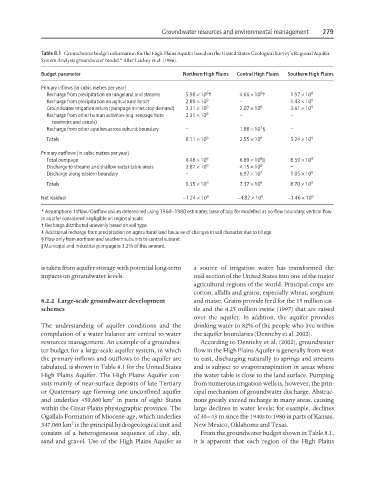
Table 8.1 Groundwater budget information for the High Plains Aquifer based on the United States Geological Survey’s Regional Aquifer
System Analysis groundwater model.* After Luckey et al. (1986).
Budget parameter Northern High Plains Central High Plains Southern High Plains
Primary inflows (in cubic metres per year)
8
8
Recharge from precipitation on rangeland and streams 5.98 × 10 † 4.66 × 10 † 1.97 × 10 8
Recharge from precipitation on agricultural land‡ 2.89 × 10 9 – 1.43 × 10 9
Groundwater irrigation return (pumpage minus crop demand) 2.31 × 10 9 2.07 × 10 9 3.61 × 10 9
Recharge from other human activities (e.g. seepage from 2.31 × 10 9 – –
reservoirs and canals)
7
Recharge from other aquifers across subunit boundary – 1.88 × 10 § –
Totals 8.11 × 10 9 2.55 × 10 9 5.24 × 10 9
Primary outflows (in cubic metres per year)
9
Total pumpage 6.48 × 10 9 6.89 × 10 || 8.59 × 10 9
Discharge to streams and shallow water-table areas 2.87 × 10 9 4.15 × 10 8 –
Discharge along eastern boundary – 6.97 × 10 7 1.05 × 10 8
Totals 9.35 × 10 9 7.37 × 10 9 8.70 × 10 9
Net residual −1.24 × 10 9 −4.82 × 10 9 −3.46 × 10 9
* Assumptions: Inflow/Outflow values determined using 1960–1980 estimates; base of aquifer modelled as no-flow boundary; vertical flow
in aquifer considered negligible on regional scale.
† Recharge distributed unevenly based on soil type.
‡ Additional recharge from precipitation on agricultural land because of changes in soil character due to tillage.
§ Flow only from northern and southern subunits to central subunit.
|| Municipal and industrial pumpage is 3.2% of this amount.
is taken from aquifer storage with potential long-term a source of irrigation water has transformed the
impacts on groundwater levels. mid-section of the United States into one of the major
agricultural regions of the world. Principal crops are
cotton, alfalfa and grains, especially wheat, sorghum
8.2.2 Large-scale groundwater development and maize. Grains provide feed for the 15 million cat-
schemes tle and the 4.25 million swine (1997) that are raised
over the aquifer. In addition, the aquifer provides
The understanding of aquifer conditions and the drinking water to 82% of the people who live within
compilation of a water balance are central to water the aquifer boundaries (Dennehy et al. 2002).
resources management. An example of a groundwa- According to Dennehy et al. (2002), groundwater
ter budget for a large-scale aquifer system, in which flow in the High Plains Aquifer is generally from west
the primary inflows and outflows to the aquifer are to east, discharging naturally to springs and streams
tabulated, is shown in Table 8.1 for the United States and is subject to evapotranspiration in areas where
High Plains Aquifer. The High Plains Aquifer con- the water table is close to the land surface. Pumping
sists mainly of near-surface deposits of late Tertiary from numerous irrigation wells is, however, the prin-
or Quaternary age forming one unconfined aquifer cipal mechanism of groundwater discharge. Abstrac-
2
and underlies 450,660 km in parts of eight States tions greatly exceed recharge in many areas, causing
within the Great Plains physiographic province. The large declines in water levels; for example, declines
Ogallala Formation of Miocene age, which underlies of 30–43 m since the 1940s to 1980 in parts of Kansas,
2
347,060 km is the principal hydrogeological unit and New Mexico, Oklahoma and Texas.
consists of a heterogeneous sequence of clay, silt, From the groundwater budget shown in Table 8.1,
sand and gravel. Use of the High Plains Aquifer as it is apparent that each region of the High Plains