
Page 332 - Hydrogeology Principles and Practice
P. 332
HYDC08 12/5/05 5:32 PM Page 315
Groundwater resources and environmental management 315
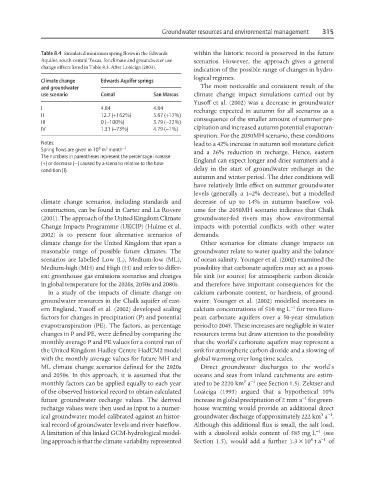
Table 8.4 Simulated minimum spring flows in the Edwards within the historic record is preserved in the future
Aquifer, south-central Texas, for climate and groundwater use scenarios. However, the approach gives a general
change effects listed in Table 8.3. After Loáiciga (2003).
indication of the possible range of changes in hydro-
logical regimes.
Climate change Edwards Aquifer springs
and groundwater The most noticeable and consistent result of the
use scenario Comal San Marcos climate change impact simulations carried out by
Yusoff et al. (2002) was a decrease in groundwater
I 4.84 4.84 recharge expected in autumn for all scenarios as a
II 12.7 (+162%) 5.67 (+17%)
III 0 (−100%) 3.79 (−22%) consequence of the smaller amount of summer pre-
IV 1.31 (−73%) 4.79 (−1%) cipitation and increased autumn potential evapotran-
spiration. For the 2050MH scenario, these conditions
Notes: lead to a 42% increase in autumn soil moisture deficit
6
3
−1
Spring flows are given in 10 m month . and a 26% reduction in recharge. Hence, eastern
The numbers in parentheses represent the percentage increase
(+) or decrease (−) caused by a scenario relative to the base England can expect longer and drier summers and a
condition (I). delay in the start of groundwater recharge in the
autumn and winter period. The drier conditions will
have relatively little effect on summer groundwater
levels (generally a 1–2% decrease), but a modelled
climate change scenarios, including standards and decrease of up to 14% in autumn baseflow vol-
construction, can be found in Carter and La Rovere ume for the 2050MH scenario indicates that Chalk
(2001). The approach of the United Kingdom Climate groundwater-fed rivers may show environmental
Change Impacts Programme (UKCIP) (Hulme et al. impacts with potential conflicts with other water
2002) is to present four alternative scenarios of demands.
climate change for the United Kingdom that span a Other scenarios for climate change impacts on
reasonable range of possible future climates. The groundwater relate to water quality and the balance
scenarios are labelled Low (L), Medium-low (ML), of ocean salinity. Younger et al. (2002) examined the
Medium-high (MH) and High (H) and refer to differ- possibility that carbonate aquifers may act as a possi-
ent greenhouse gas emissions scenarios and changes ble sink (or source) for atmospheric carbon dioxide
in global temperature for the 2020s, 2050s and 2080s. and therefore have important consequences for the
In a study of the impacts of climate change on calcium carbonate content, or hardness, of ground-
groundwater resources in the Chalk aquifer of east- water. Younger et al. (2002) modelled increases in
−1
ern England, Yusoff et al. (2002) developed scaling calcium concentrations of ≤10 mg L for two Euro-
factors for changes in precipitation (P) and potential pean carbonate aquifers over a 50-year simulation
evapotranspiration (PE). The factors, as percentage period to 2045. These increases are negligible in water
changes in P and PE, were defined by comparing the resources terms but draw attention to the possibility
monthly average P and PE values for a control run of that the world’s carbonate aquifers may represent a
the United Kingdom Hadley Centre HadCM2 model sink for atmospheric carbon dioxide and a slowing of
with the monthly average values for future MH and global warming over long time scales.
ML climate change scenarios defined for the 2020s Direct groundwater discharges to the world’s
and 2050s. In this approach, it is assumed that the oceans and seas from inland catchments are estim-
3 −1
monthly factors can be applied equally to each year ated to be 2220 km a (see Section 1.5). Zektser and
of the observed historical record to obtain calculated Loaiciga (1993) argued that a hypothetical 10%
−1
future groundwater recharge values. The derived increase in global precipitation of 2 mm a for green-
recharge values were then used as input to a numer- house warming would provide an additional direct
3 −1
ical groundwater model calibrated against an histor- groundwater discharge of approximately 222 km a .
ical record of groundwater levels and river baseflow. Although this additional flux is small, the salt load,
A limitation of this linked GCM-hydrological model- with a dissolved solids content of 585 mg L −1 (see
8
ling approach is that the climate variability represented Section 1.5), would add a further 1.3 × 10 ta −1 of