
Page 330 - Hydrogeology Principles and Practice
P. 330
HYDC08 12/5/05 5:32 PM Page 313
Groundwater resources and environmental management 313
BO X
Continued
8.7
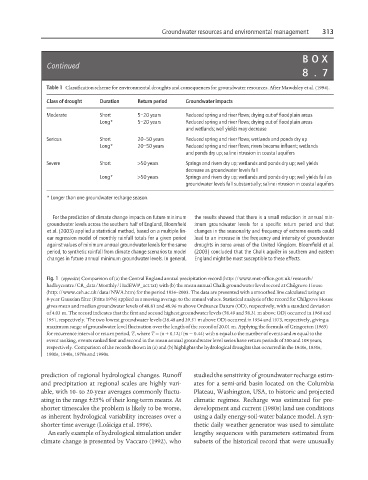
Table 1 Classification scheme for environmental droughts and consequences for groundwater resources. After Mawdsley et al. (1994).
Class of drought Duration Return period Groundwater impacts
Moderate Short 5–20 years Reduced spring and river flows; drying out of floodplain areas
Long* 5–20 years Reduced spring and river flows; drying out of floodplain areas
and wetlands; well yields may decrease
Serious Short 20–50 years Reduced spring and river flows; wetlands and ponds dry up
Long* 20–50 years Reduced spring and river flows; rivers become influent; wetlands
and ponds dry up; saline intrusion in coastal aquifers
Severe Short >50 years Springs and rivers dry up; wetlands and ponds dry up; well yields
decrease as groundwater levels fall
Long* >50 years Springs and rivers dry up; wetlands and ponds dry up; well yields fail as
groundwater levels fall substantially; saline intrusion in coastal aquifers
* Longer than one groundwater recharge season.
For the prediction of climate change impacts on future minimum the results showed that there is a small reduction in annual min-
groundwater levels across the southern half of England, Bloomfield imum groundwater levels for a specific return period and that
et al. (2003) applied a statistical method, based on a multiple lin- changes in the seasonality and frequency of extreme events could
ear regression model of monthly rainfall totals for a given period lead to an increase in the frequency and intensity of groundwater
against values of minimum annual groundwater levels for the same droughts in some areas of the United Kingdom. Bloomfield et al.
period, to synthetic rainfall from climate change scenarios to model (2003) concluded that the Chalk aquifer in southern and eastern
changes in future annual minimum groundwater levels. In general, England might be most susceptible to these effects.
Fig. 1 (opposite) Comparison of (a) the Central England annual precipitation record (http://www.met-office.gov.uk/research/
hadleycentre/CR_data/Monthly/HadEWP_act.txt) with (b) the mean annual Chalk groundwater level record at Chilgrove House
(http://www.ceh.ac.uk/data/NWA.htm) for the period 1836–2003. The data are presented with a smoothed line calculated using an
8-year Gaussian filter (Fritts 1976) applied as a moving average to the annual values. Statistical analysis of the record for Chilgrove House
gives mean and median groundwater levels of 48.81 and 48.96 m above Ordnance Datum (OD), respectively, with a standard deviation
of 4.03 m. The record indicates that the first and second highest groundwater levels (58.49 and 58.31 m above OD) occurred in 1960 and
1951, respectively. The two lowest groundwater levels (38.48 and 39.51 m above OD) occurred in 1934 and 1973, respectively, giving a
maximum range of groundwater level fluctuation over the length of the record of 20.01 m. Applying the formula of Gringorten (1963)
for recurrence interval or return period, T, where T = (n + 0.12)/(m − 0.44) with n equal to the number of events and m equal to the
event ranking, events ranked first and second in the mean annual groundwater level series have return periods of 300 and 108 years,
respectively. Comparison of the records shown in (a) and (b) highlights the hydrological droughts that occurred in the 1840s, 1850s,
1900s, 1940s, 1970s and 1990s.
prediction of regional hydrological changes. Runoff studied the sensitivity of groundwater recharge estim-
and precipitation at regional scales are highly vari- ates for a semi-arid basin located on the Columbia
able, with 10- to 20-year averages commonly fluctu- Plateau, Washington, USA, to historic and projected
ating in the range ±25% of their long-term means. At climatic regimes. Recharge was estimated for pre-
shorter timescales the problem is likely to be worse, development and current (1980s) land use conditions
as inherent hydrological variability increases over a using a daily energy-soil-water balance model. A syn-
shorter time average (Loáiciga et al. 1996). thetic daily weather generator was used to simulate
An early example of hydrological simulation under lengthy sequences with parameters estimated from
climate change is presented by Vaccaro (1992), who subsets of the historical record that were unusually