
Page 326 - Hydrogeology Principles and Practice
P. 326
HYDC08 12/5/05 5:32 PM Page 309
Groundwater resources and environmental management 309
Table 8.2 Major sources, concentrations and residence times of important ‘greenhouse’ gases in the atmosphere. After IPCC (2001).
Greenhouse gas Pre-industrial Present Residence time Annual rate Major sources
concentration concentration of increase*
(1750) (1998)
Water vapour 3000 ppm 3000 ppm 10–15 days n.a. Oceans
−1
CO (carbon dioxide) ~ 280 ppm ~ 365 ppm 5–200 years† 1.5 ppm a ‡ Combustion of fossil fuels, deforestation
2
−1
CH (methane) 700 ppb 1745 ppb 12 years§ 7.0 ppb a ‡ Rice production, cattle rearing, industry
4 ~
N O (nitrous oxide) ~ 270 ppb 314 ppb 114 years§ 0.8 ppb a −1 Agriculture, industry, biomass burning
2
CFC-11 (chlorofluorocarbon-11) 0 268 ppt 45 years −1.4 ppt a −1 Aerosols, refrigeration
HFC-23 (hydrofluorocarbon-23) 0 14 ppt 260 years 0.55 ppt a −1 Industrial byproduct
CF (perfluoromethane) 40 ppt 80 ppt >50,000 years 1 ppt a −1 Aluminium industry
4
n.a., not applicable.
* Rate is calculated over the period 1990 to 1999.
† No single lifetime can be defined for CO because of the different rates of uptake by different removal processes.
2
−1
−1
−1
‡ Rate has fluctuated between 0.9 ppm a and 2.8 ppm a for CO and between 0 and 13 ppb a for CH over the period 1990–1999.
4
2
§ This lifetime has been defined as an ‘adjustment’ time that takes into account the indirect effect of the gas on its own residence time.
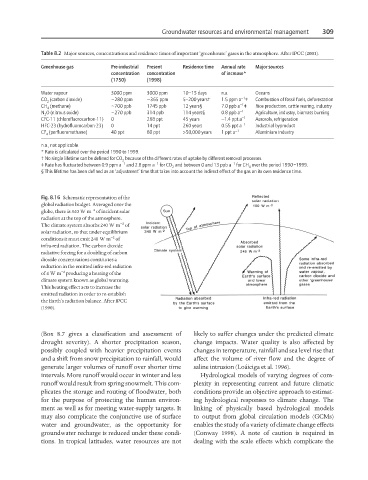
Fig. 8.16 Schematic representation of the
global radiation budget. Averaged over the
−2
globe, there is 340 W m of incident solar
radiation at the top of the atmosphere.
−2
The climate system absorbs 240 W m of
solar radiation, so that under equilibrium
−2
conditions it must emit 240 W m of
infra-red radiation. The carbon dioxide
radiative forcing for a doubling of carbon
dioxide concentrations constitutes a
reduction in the emitted infra-red radiation
−2
of 4 W m producing a heating of the
climate system known as global warming.
This heating effect acts to increase the
emitted radiation in order to re-establish
the Earth’s radiation balance. After IPCC
(1990).
(Box 8.7 gives a classification and assessment of likely to suffer changes under the predicted climate
drought severity). A shorter precipitation season, change impacts. Water quality is also affected by
possibly coupled with heavier precipitation events changes in temperature, rainfall and sea level rise that
and a shift from snow precipitation to rainfall, would affect the volume of river flow and the degree of
generate larger volumes of runoff over shorter time saline intrusion (Loáiciga et al. 1996).
intervals. More runoff would occur in winter and less Hydrological models of varying degrees of com-
runoff would result from spring snowmelt. This com- plexity in representing current and future climatic
plicates the storage and routing of floodwater, both conditions provide an objective approach to estimat-
for the purpose of protecting the human environ- ing hydrological responses to climate change. The
ment as well as for meeting water-supply targets. It linking of physically based hydrological models
may also complicate the conjunctive use of surface to output from global circulation models (GCMs)
water and groundwater, as the opportunity for enables the study of a variety of climate change effects
groundwater recharge is reduced under these condi- (Conway 1998). A note of caution is required in
tions. In tropical latitudes, water resources are not dealing with the scale effects which complicate the