
Page 322 - Hydrogeology Principles and Practice
P. 322
HYDC08 12/5/05 5:32 PM Page 305
Groundwater resources and environmental management 305
BO X
Continued
8.5
thus maintaining a soligenous hydrology (where wetness of the site the invasion of scrub. The reduction in the water table altered the
is maintained by water flow through soil), was replaced by a sea- balance of competition towards dry fen species and the expansion
sonal downward movement of surface water. The hydrology of the of Phragmites and Molinia, which are tolerant of low water levels,
fen had now become controlled by rainfall patterns and river levels while previously dominant species such as Cladium and Schoenus
thus producing a topogenous hydrology (where wetness is main- contracted. The loss of calcareous and base-poor seepage water and
tained by the valley topography). During the summer, the fen dried the increased fertility from the sudden release of large amounts of
out more frequently with groundwater heads reduced to a metre stored nitrates through peat wastage under a lower water level also
below the fen surface. Test pumping and radial flow modelling sug- benefited Phragmites.
gested that about a quarter of the pumped groundwater was at the To reverse the environmental damage, the groundwater pump-
expense of spring flow into the fen (Burgess 2002). ing was relocated to a borehole 3.5 km east and downstream of the
These hydrogeological changes caused by groundwater abstrac- fen that became operational in 1999. The total cost of the replace-
tion were matched to a deterioration of the flora and fauna at the ment supply was of the order of £3.3 million (US$4.8 million),
site (Harding 1993). From a comparative study of botanical records, which included the cost of the investigation, source works, pipeline
Harding (1993) showed that great changes had occurred to the and restoration work on the fen, principally the removal of scrub
ecological character of the fen as a result of the drying out, namely and the regeneration of peat areas.
leading to an increase in global temperature (Fig. 8.16). the interactions and feedback loops that give rise to
Opposite effects that act to cool the climate include the complexities of the system (Askew 1987). Climate
other atmospheric pollutants such as sulphate aerosols change during the next 100 years is expected to lead
that absorb and scatter incoming solar radiation back to an intensification of the global hydrological cycle
to space. To counter global warming, and under the and have major impacts on regional water resources
Kyoto Protocol, countries of the European Union are (IPCC 1998). A summary of the likely impacts of
committed to an 8% reduction in emissions from climate change on natural hydrological systems is
1990 levels of a ‘basket’ of six gases, including carbon shown in Fig. 8.17. The potential water resources
dioxide, methane and nitrous oxide by 2008–2012. impacts of climate change are generally negative,
The hydrological cycle is an integral part of the such as a shorter precipitation season and an increase
climate system and is therefore involved in many of in hydrological extremes such as floods and droughts
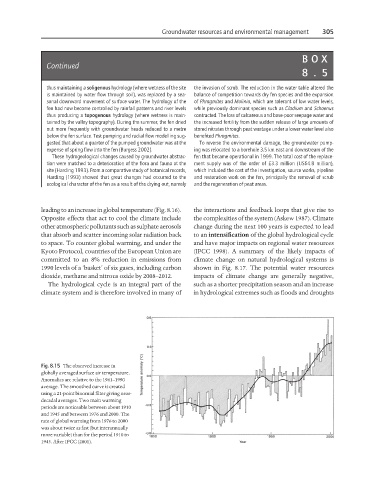
Fig. 8.15 The observed increase in
globally averaged surface air temperature.
Anomalies are relative to the 1961–1990
average. The smoothed curve is created
using a 21-point binomial filter giving near-
decadal averages. Two main warming
periods are noticeable between about 1910
and 1945 and between 1976 and 2000. The
rate of global warming from 1976 to 2000
was about twice as fast (but interannually
more variable) than for the period 1910 to
1945. After IPCC (2001).