
Page 138 - Improving Machinery Reliability
P. 138
110 Improving Machine9 Reliability
N I
>
0
z
W
3
0
W
lx
LL
I- z
I
0
ln
LY
W
J
U
z
0
H
v)
(*:
I-
0
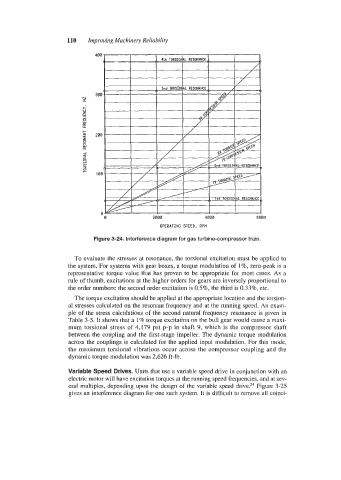
Figure 3-24. Interference diagram for gas turbine-compressor train.
To evaluate the stresses at resonance, the torsional excitation must be applied to
the system. For systems with gear boxes, a torque modulation of 1%, zero-peak is a
representative torque value that has proven to be appropriate for most cases. As a
rule of thumb, excitations at the higher orders for gears are inversely proportional to
the order numbers: the second order excitation is 0.5%, the third is 0.33%, etc.
The torque excitation should be applied at the appropriate location and the torsion-
al stresses calculated on the resonant frequency and at the running speed. An exam-
ple of the stress calculations of the second natural frequency resonance is given in
Table 3-5. It shows that a 1% torque excitation on the bull gear would cause a maxi-
mum torsional stress of 4,179 psi p-p in shaft 9, which is the compressor shaft
between the coupling and the first-stage impeller. The dynamic torque modulation
across the couplings is calculated for the applied input modulation. For this mode,
the maximum torsional vibrations occur across the compressor coupling and the
dynamic torque modulation was 2,626 ft-lb.
Variable Speed Drives. Units that use a variable speed drive in conjunction with an
electric motor will have excitation torques at the running speed frequencies, and at sev-
eral multiples, depending upon the design of the variable speed dri~e.2~ Figure 3-25
gives an interference diagram for one such system. It is difficult to remove all coinci-