
Page 297 - Improving Machinery Reliability
P. 297
268 Improving Machinery Reliability
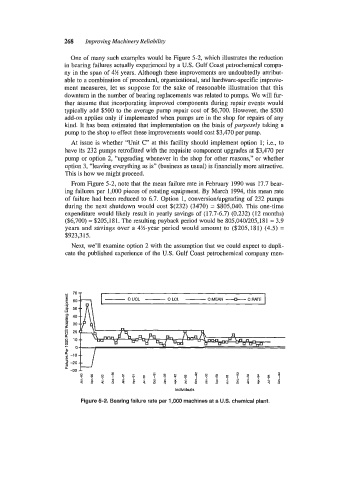
One of many such examples would be Figure 5-2, which illustrates the reduction
in bearing failures actually experienced by a U.S. Gulf Coast petrochemical compa-
ny in the span of 4% years. Although these improvements are undoubtedly attribut-
able to a combination of procedural, organizational, and hardware-specific improve-
ment measures, let us suppose for the sake of reasonable illustration that this
downturn in the number of bearing replacements was related to pumps. We will fur-
ther assume that incorporating improved components during repair events would
typically add $500 to the average pump repair cost of $6,700. However, the $500
add-on applies only if implemented when pumps are in the shop for repairs of any
kind. It has been estimated that implementation on the basis of purposely taking a
pump to the shop to effect these improvements would cost $3,470 per pump.
At issue is whether “Unit C” at this facility should implement option 1; Le., to
have its 232 pumps retrofitted with the requisite component upgrades at $3,470 per
pump or option 2, “upgrading whenever in the shop for other reasons,” or whether
option 3, “leaving everything as is” (business as usual) is financially more attractive.
This is how we might proceed.
From Figure 5-2, note that the mean failure rate in February 1990 was 17.7 bear-
ing failures per 1,000 pieces of rotating equipment. By March 1994, this mean rate
of failure had been reduced to 6.7. Option 1, conversionlupgrading of 232 pumps
during the next shutdown would cost $(232) (3470) = $805,040. This one-time
expenditure would likely result in yearly savings of (17.7-6.7) (0.232) (12 months)
($6,700) = $205,181. The resulting payback period would be 805,040/205,181 = 3.9
years and savings over a 4%-year period would amount to ($205,181) (4.5) =
$923,3 15.
Next, we’ll examine option 2 with the assumption that we could expect to dupli-
cate the published experience of the U.S. Gulf Coast petrochemical company men-
- - - -
70
.- 60 C UCL C LCL C MEAN C RATE
50
p 40
2 30
0 20
P
23 ’0
s
h 0
-30
Individuals
Figure 5-2. Bearing failure rate per 1,000 machines at a US. chemical plant.