
Page 298 - Improving Machinery Reliability
P. 298
Life Cycle Cost Studies 269
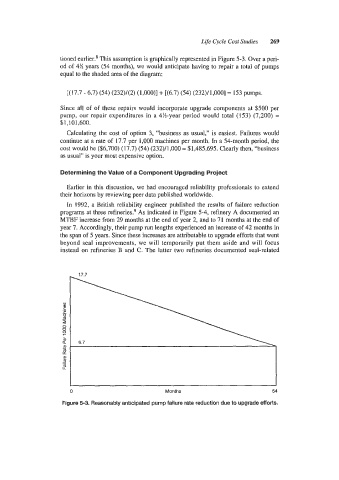
tioneld earlier.8 This assumption is graphically represented in Figure 5-3. Over a peri-
od of 4% years (54 months), we would anticipate having to repair a total of pumps
equal to the shaded area of the diagram:
[(17.7 - 6.7) (54) (232)/(2) (1,000)]+ L(6.7) (54) (232)/1,0001= 153 pumps.
Since all of of these repairs would incorporate upgrade components at $500 per
pump, our repair expenditures in a 4%-year period would total (153) (7,200) =
$1,101,600.
Calculating the cost of option 3, “business as usual,” is easiest. Failures would
continue at a rate of 17.7 per 1,000 machines per month. In a 54-month period, the
cost would be ($6,700) (17.7) (54) (232)/1,000 = $1,485,695. Clearly then, “business
as usual” is your most expensive option.
Determining the Value of a Component Upgrading Project
Earlier in this discussion, we had encouraged reliability professionals to extend
their horizons by reviewing peer data published worldwide.
In 1992, a British reliability engineer published the results of failure reduction
pr’ograms at three refineries? As indicated in Figure 5-4, refinery A documented an
MTBF increase from 29 months at the end of year 2, and to 71 months at the end of
year 7. Accordingly, their pump run lengths experienced an increase of 42 months in
the span of 5 years. Since these increases are attributable to upgrade efforts that went
beyond seal improvements, we will temporarily put them aside and will focus
instead on refineries B and C. The latter two refineries documented seal-related
0 Months 54
Figure 5-3. Reasonably anticipated pump failure rate reduction due to upgrade efforts.