
Page 300 - Improving Machinery Reliability
P. 300
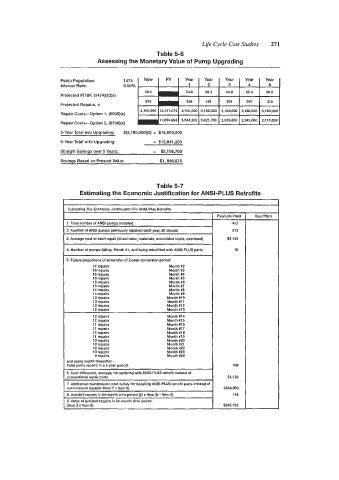
Life Cycle Cost Studies   271
                                                Table 5-6
                              Assessing the Monetary Value of Pump Upgrading


                   Pump Population:
                   Intarest Rate:
                   Projected MTBF, (1 474)(12)/x
                   Projected Repairs, x
                   Repair Costs-Option  1, (5000)(x)
                   Repair Costs-Option  2, (6700)(x)
                   5-Year Total w/o Upgrading:   $(3,160,000)(5) =  $1 5,800,000
                   5-Year Total with Upgrading:   - $1 3,641,200
                   Straight Savings over 5 Years:   =  $2,156,700
                   -                             $1,646,075
                   Sawings Based on Present Value:


                                                Table 5-7
                         Estimating the Economic Justification for ANSI-PLUS Retrofits

                     Estimatino The Economic Justification For ANSI-Plus Retrofits
                                                                  Example Plant
                                                                I
                     1. Total number of ANSI pumps installed          417
                     2.  Number of ANSI pumps previously repalred each year, 8ll causes   21 2
                     3. Average cost of each repair (direct labor, materials, associated costs, overhead)   53,122
                     4. Number of pumps failing, Month U1, and being retrofitted with ANSI-PLUS parts   18
                     5.  Failure projections of remainder of 2-year conversion period:
                             97 repairs            Month #2
                             16 repairs            Month #3
                             16 repairs            Month #4
                             16 repairs            Month #5
                             15 repairs            Month #6
                             15 repairs            Month #7
                             14 repairs            Month #8
                             14 repairs            Month #9
                             13 repairs            Month (110
                             13  repairs           Month #11
                             12 repairs            Month #12
                             12  repairs           Month #13
                             12  repairs           Month #14
                             12 repairs            Month #15
                             11 repairs            Month X16
                             11 repairs            Month #17
                             11 repairs            Month #18
                             11 repairs            Month #19
                             10  repairs           Month #20
                             10 repairs            Month U21
                             10  repairs           Month 1122
                             10  repairs           Month U23
                             9 repairs             Month U24
                     and every month thereafter.
                     Total  pump repairs in a 2 year period           308
                     6.  Cost difference, average, for repairing with ANSI-PLUS retrofit instead of
                                                                     51120
                     7. Additional maintenance cost outlay for installing ANSI-PLUS retrofit parts instead of
                                                                    5344,960
                                                                      116
                     (Item 3 x Item 8)                          I   5362,152